Download PDF
Download page Wallboards.
Wallboards
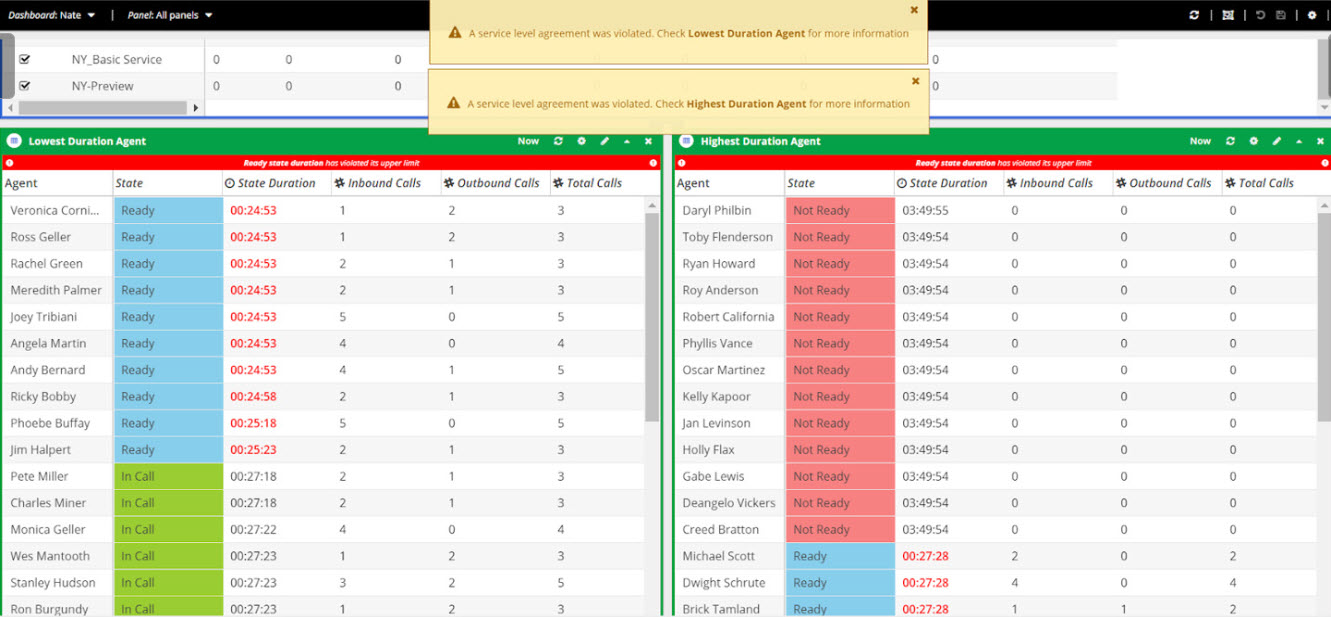
The LiveVox Wallboards feature is an independent web application that enables you to configure dashboards that display key performance indicators (KPIs) related to your call center volume (for inbound and outbound services) and agent or team productivity. Wallboards provides templates to display KPIs and these templates can be easily customized to match the needs of the organization and can be displayed on one or multiple screens throughout the contact center. Wallboards can display real-time metrics for the overall performance and progress of a call center (for example, average hold duration, average speed of answer, or call abandon rate). Wallboards also supports drill-down capabilities, allowing managers to view detailed information about specific calls, interactions and campaigns. Wallboards can also highlight real-time problems that require the attention of a manager or supervisor (for example, when an agent has been in the same state for a long time, or when a service level agreement (SLA) has been violated), through alerts.
The data on the wallboards can be configured to display in various formats, such as graphs, charts, and tables, and also it can be configured to display real-time alerts and notifications. Additionally, the system can also be integrated with other systems, such as a CRM, to provide a more comprehensive view of customer interactions and support better decision making.
A dashboard can be displayed on any screen, such as a tablet, a desktop computer, or a widescreen office monitor, for private or public view, so you can monitor the activities related to your call center in real time. In general, a dashboard that appears on a large screen is called a wallboard.
- Wallboards use data from the LiveVox Platform.
- For additional help, contact the LiveVox Customer Care Team.
Benefits
The LiveVox Wallboards application offers you the following benefits:
- Provides visibility into your contact center operations and KPIs in one place.
- Enables you to create visual alerts that notify your managers and agents when important thresholds have been crossed.
- Enables you to design a series of custom dashboards with graphs, charts, or grids that include the right metrics.
The process of creating and using Wallboards is summarized as follows: