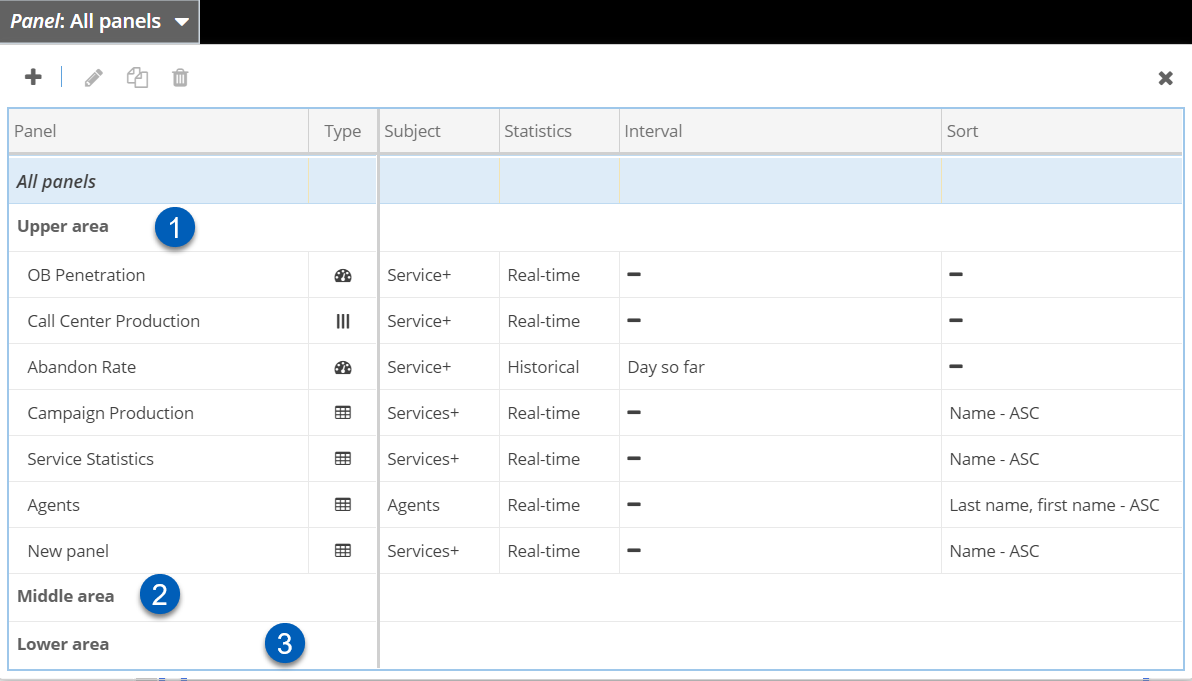
ThePanelmenu contains a table of all panels for the dashboard that you have selected on theDashboardmenu. The panels are grouped into the following categories:
Upper area: Represents a panel that appears in the upper area on a wallboard.
Middle area: Represents a panel that appears in the middle area on a wallboard.
Lower area: Represents a panel that appears in the lower area on a wallboard.
You can change the area of a panel by dragging it to the area where you want it, within the table.
Columns
The table displays the following columns:
Panel: Name of a panel.
Type: Type of view for a panel (for example, grid or array).
Subject:Subject used for the panel (for example, agents or services).
Statistics:Type of statistics used for the panel (for example, historical or real-time).
Interval: Interval used for the panel (for example, last hour or last 15 minutes) if the statistic type of the panel is historical.
Sort: Type of sorting used for the entries in the panel (for example, ascending or descending order).
Icons
The table displays the following icons:
Add a panel to the selected dashboard : Creates a panel for the dashboard that you have selected on theDashboardmenu.
Rename the selected panel :Renames a panel.
Duplicate the selected panel :Copies a panel.
Delete the selected panel :Deletes a panel.
Before you rename, copy, or delete a panel, ensure that you have selected the panel on thePanel menu.