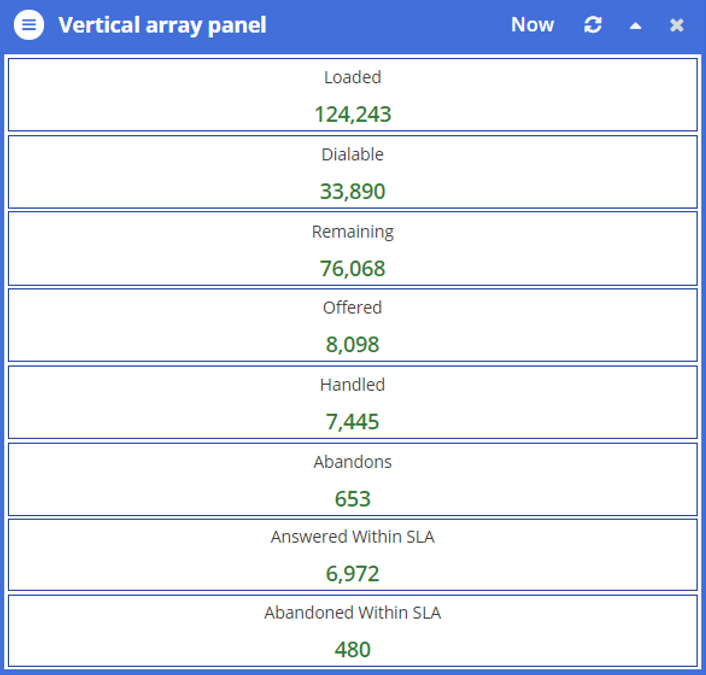
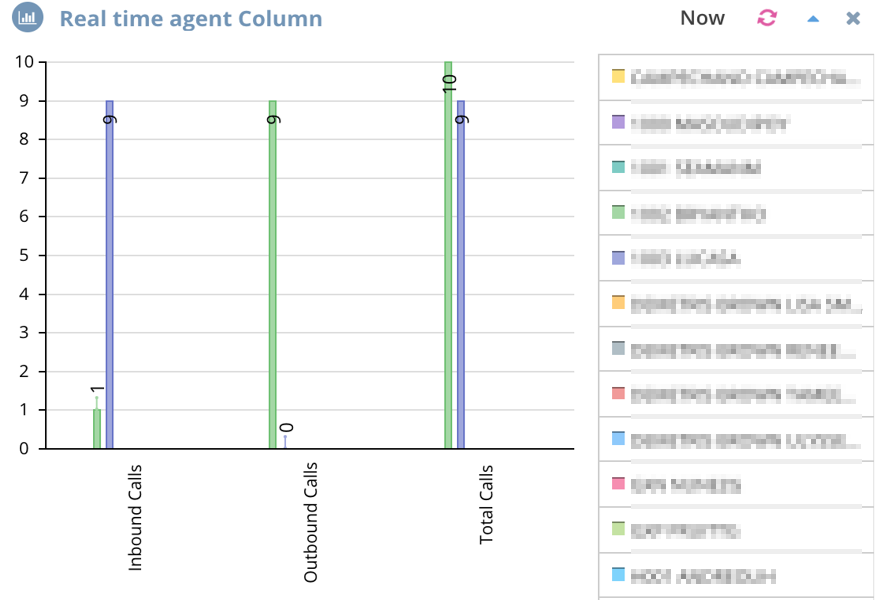
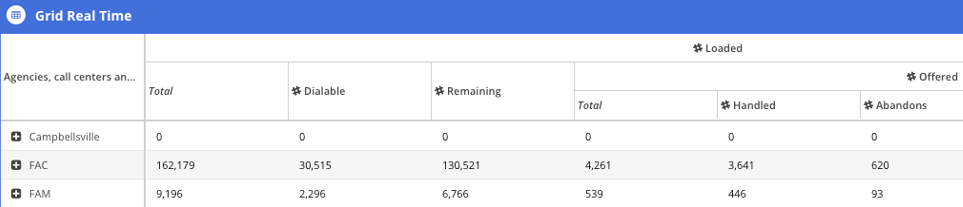
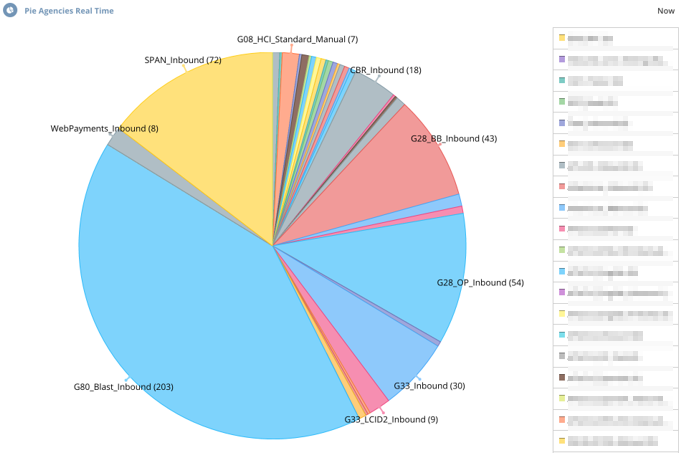
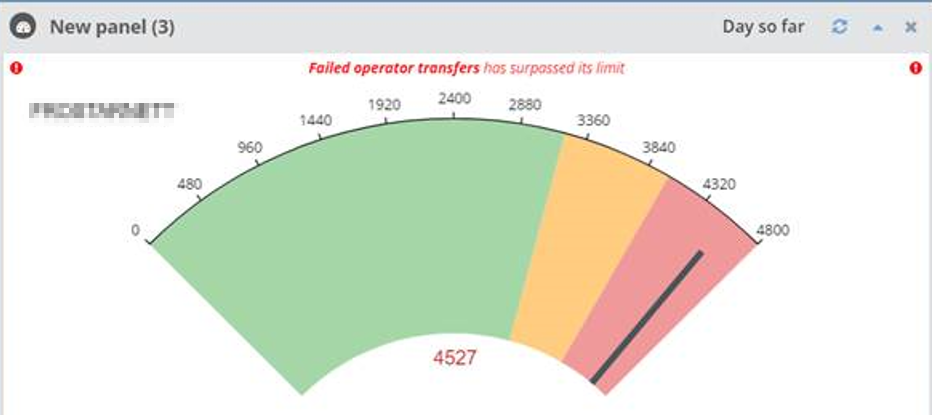
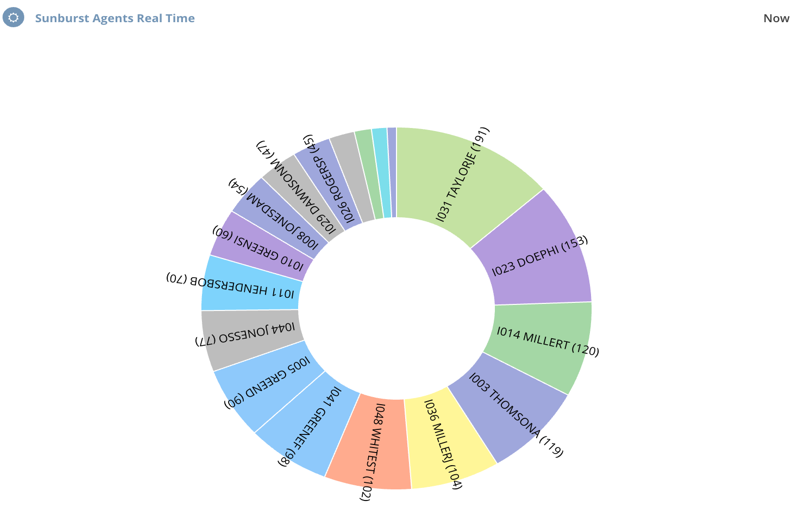
Admin Guides Wallboards Current: Customizing the Panel Views PDF Download PDF Download page Customizing the Panel Views. Current page All pages Customizing the Panel Views When designing a panel, you can specify the view in which you want the panel to appear on the dashboard.ExampleThe following table contains an image as an example to represent each view.ViewExampleArray (horizontal)Array (vertical)Bar chartColumn chartGridPie chartSpeedometerSunburst chartTabsThe following table contains the names of the tabs that appear in the Editor window when designing a panel, for each view.ViewTabsArray (horizontal)TopicTilesArray (vertical)Bar chartBarsTopicColumn chartGridRowsColumnsPie chartPie wedgesTopicSpeedometerTopicMeasureSunburst chartSunburst wedgesTopic For the bar, column, pie, and sunburst charts, in the Editor window, you can select the following types of colors by using the Colors menu:Monochrome: Displays the sections of the chart in various shades of the same color.Pastels: Displays the sections of the chart in pastel colors.Single hue: Displays the sections of the chart in the same color.In the Editor window, you can also modify the font size and the frame color for the panel by using the gear icon . ×