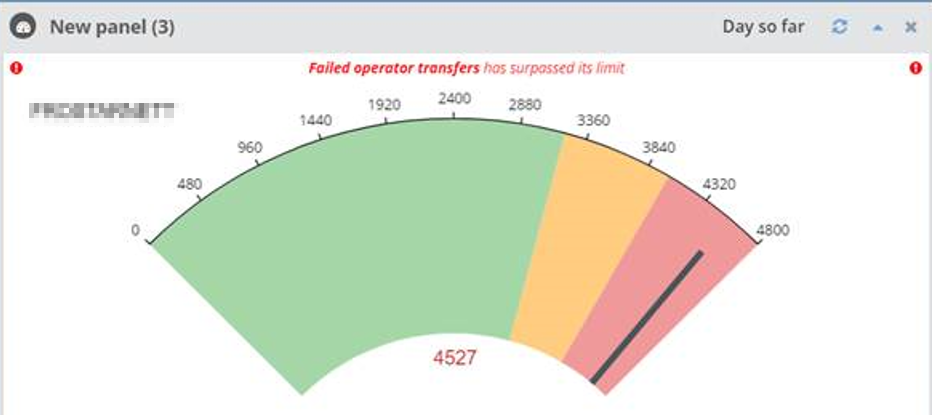
In a panel displaying a speedometer, the chart is divided into three sectors based on SLAs. The needle that appears in the speedometer indicates if the SLAs are violated. The sectors are displayed in the following colors:
- Green: This sector ends at 80% of the SLA limit. A needle in this sector indicates that no violation has occurred or is likely to occur.
- Orange: This sector begins at 80% of the SLA limit. A needle in this sector indicates a warning (that is, a violation is likely to occur).
- Red: This sector ends at 20% of the SLA limit. A needle in this sector indicates that a violation has occurred.
