The real-time Monitor Dashboard has been upgraded with the following new features to help you efficiently manage your call centers or services and easily conduct insightful comparative analysis. The customization options discussed below are available for all channels—Voice, SMS, Email, and Chat.
- To access the Monitor Dashboard features discussed below, contact Nice Customer Care.
- The ability to create and share dashboards is defined in the User Role configuration (Config > System > Roles).
Create New Dashboards and Clone Dashboards
You can create new dashboards, add widgets to monitor key statistics for your organization, and easily publish these dashboards. Dashboards can also be cloned or duplicated, allowing you to make further modifications without starting from scratch.
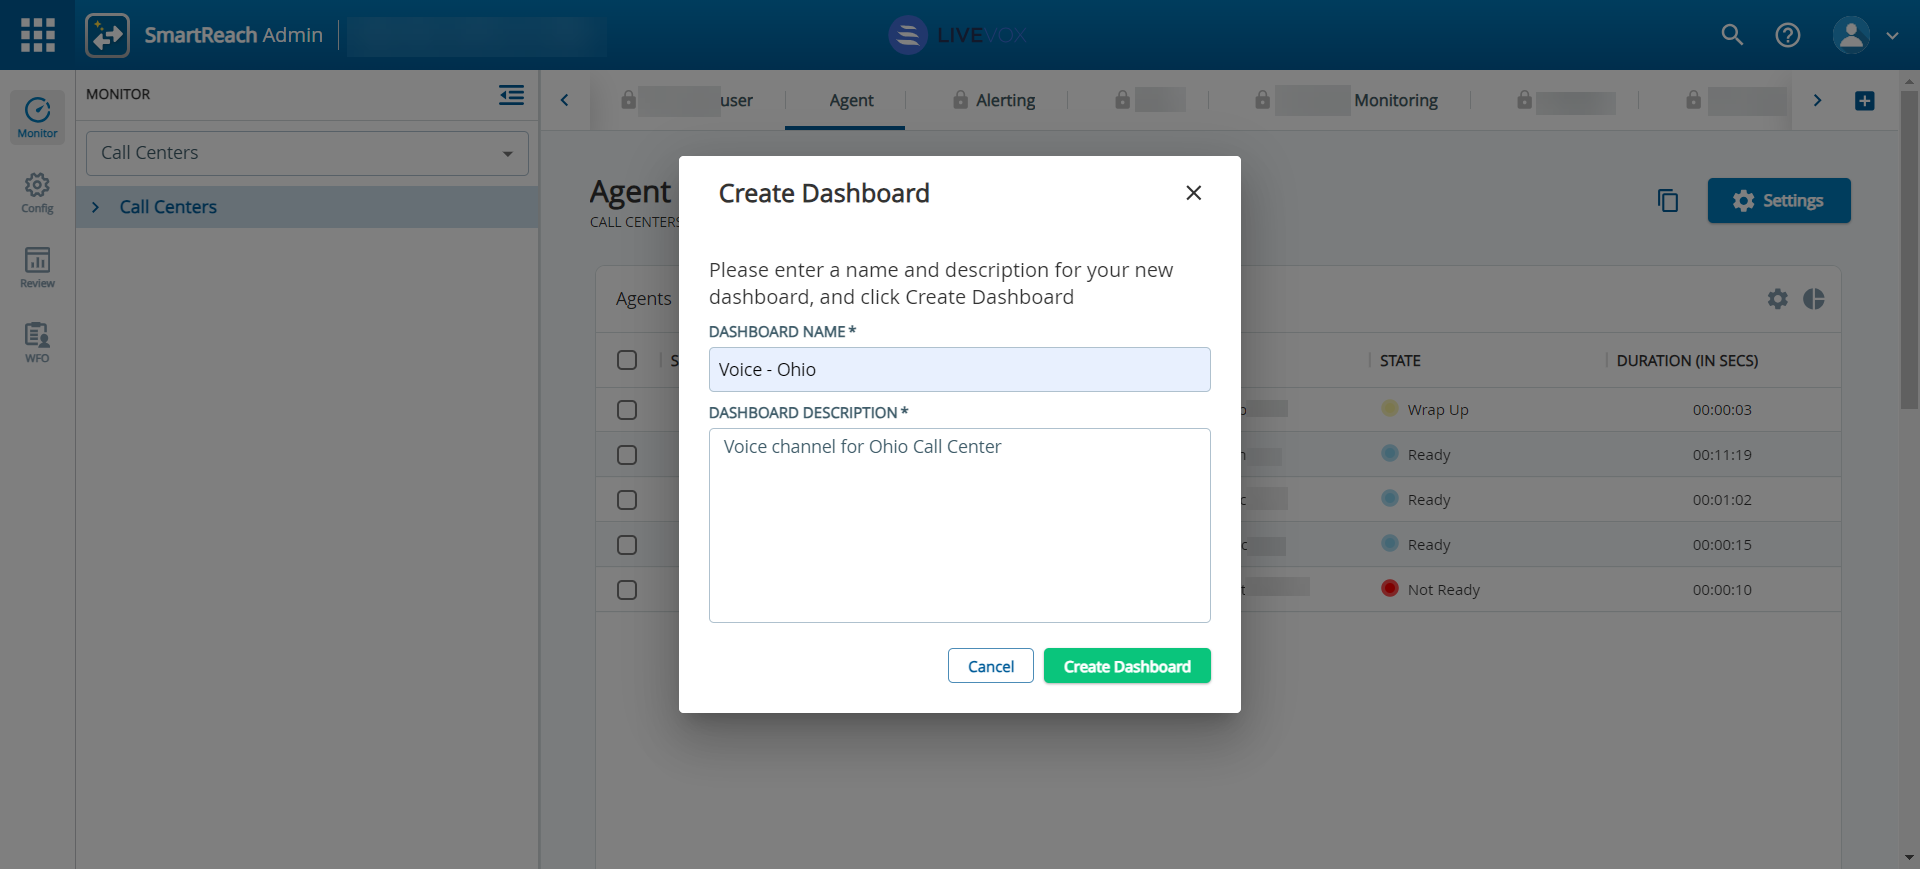
The

icon indicates that the dashboard is locked for editing and you must clone the dashboard to customize it further.
Share Dashboards
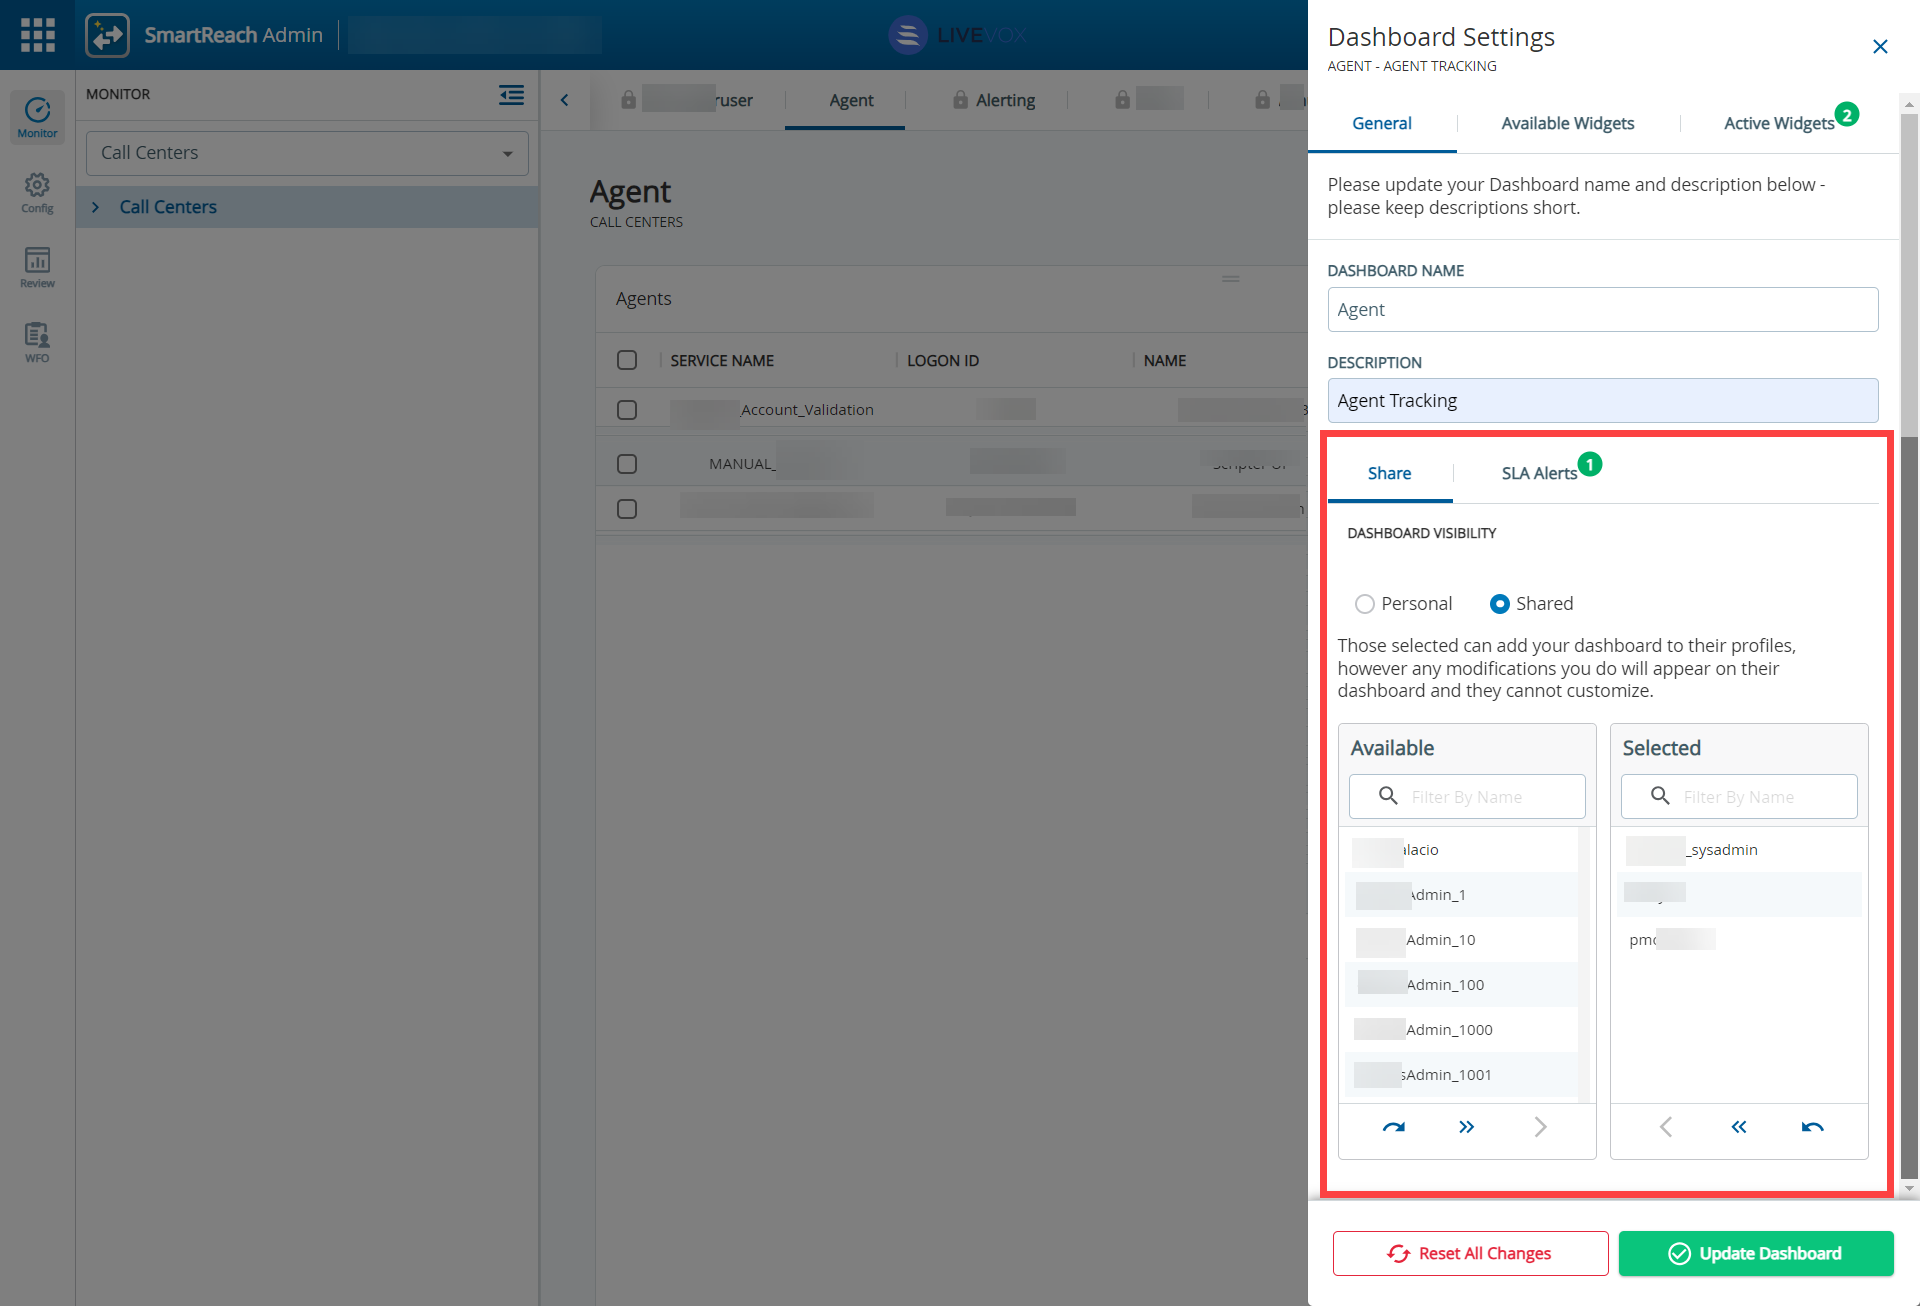
You can share dashboards that you create with other users in your organization, or you can keep them private.
To modify a shared dashboard, simply duplicate it and make the necessary changes to the copy, leaving the original intact.
Customize Dashboards
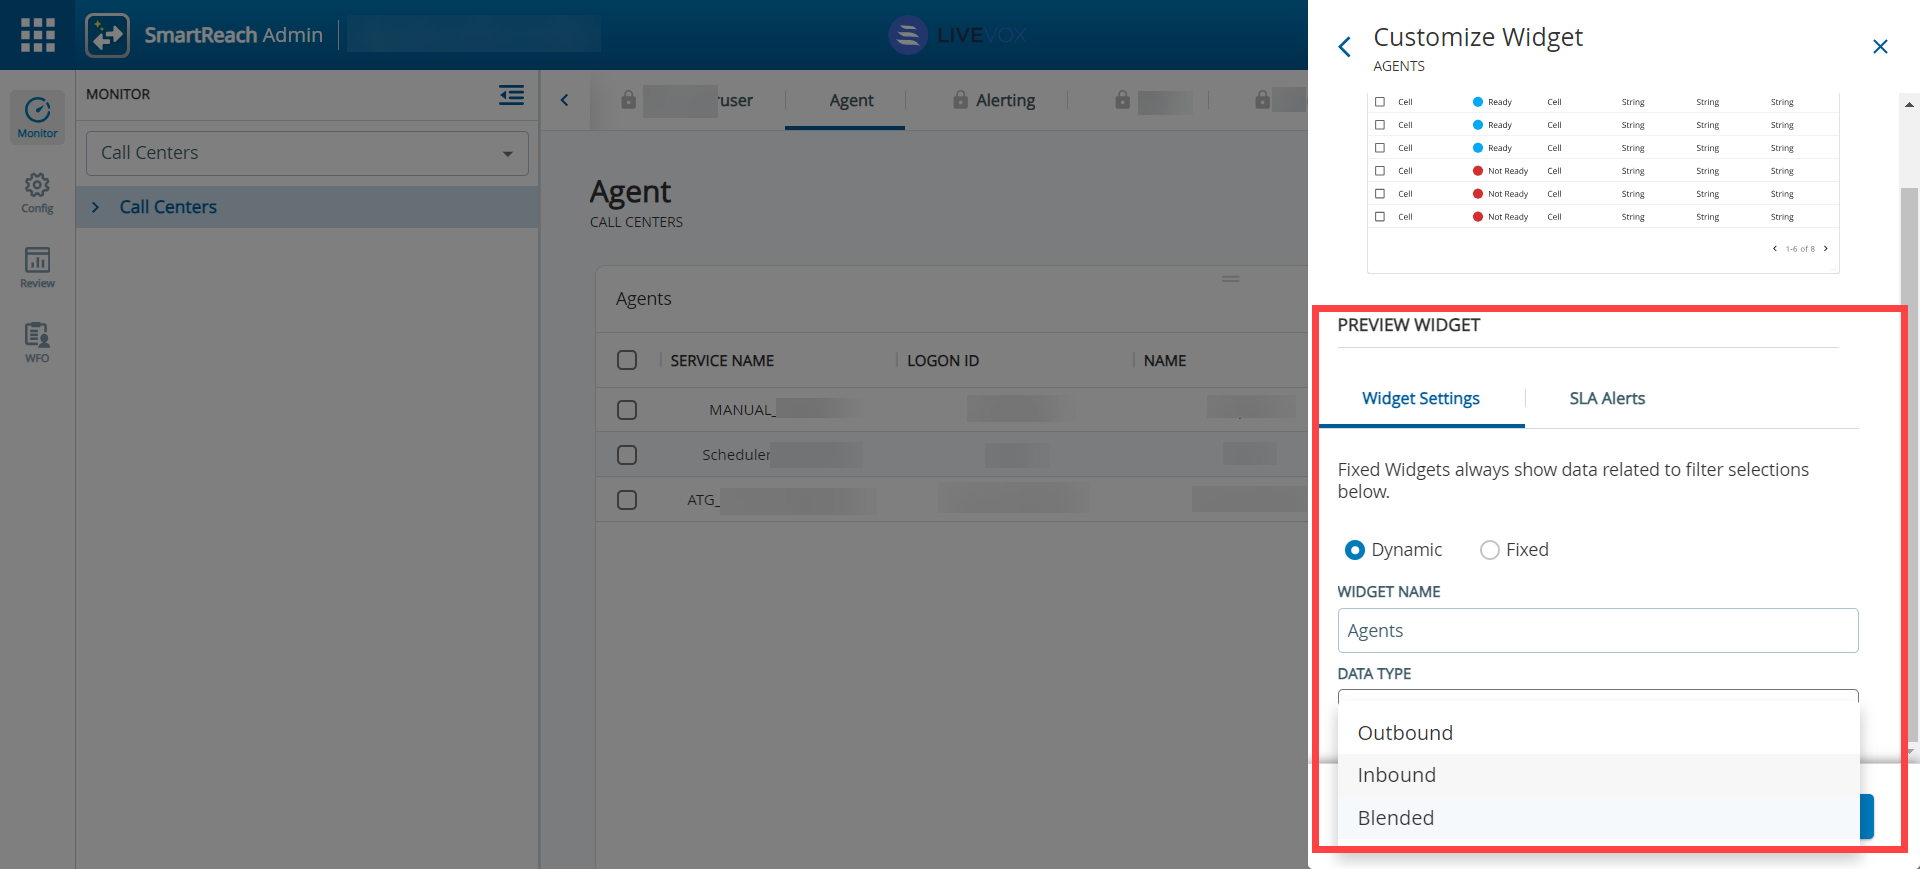
You can now fully customize your dashboards by adding widgets tailored to your specific monitoring needs—whether for Enterprise, Call Center, Service Group, or individual Services—ensuring alignment with your organization’s business goals.
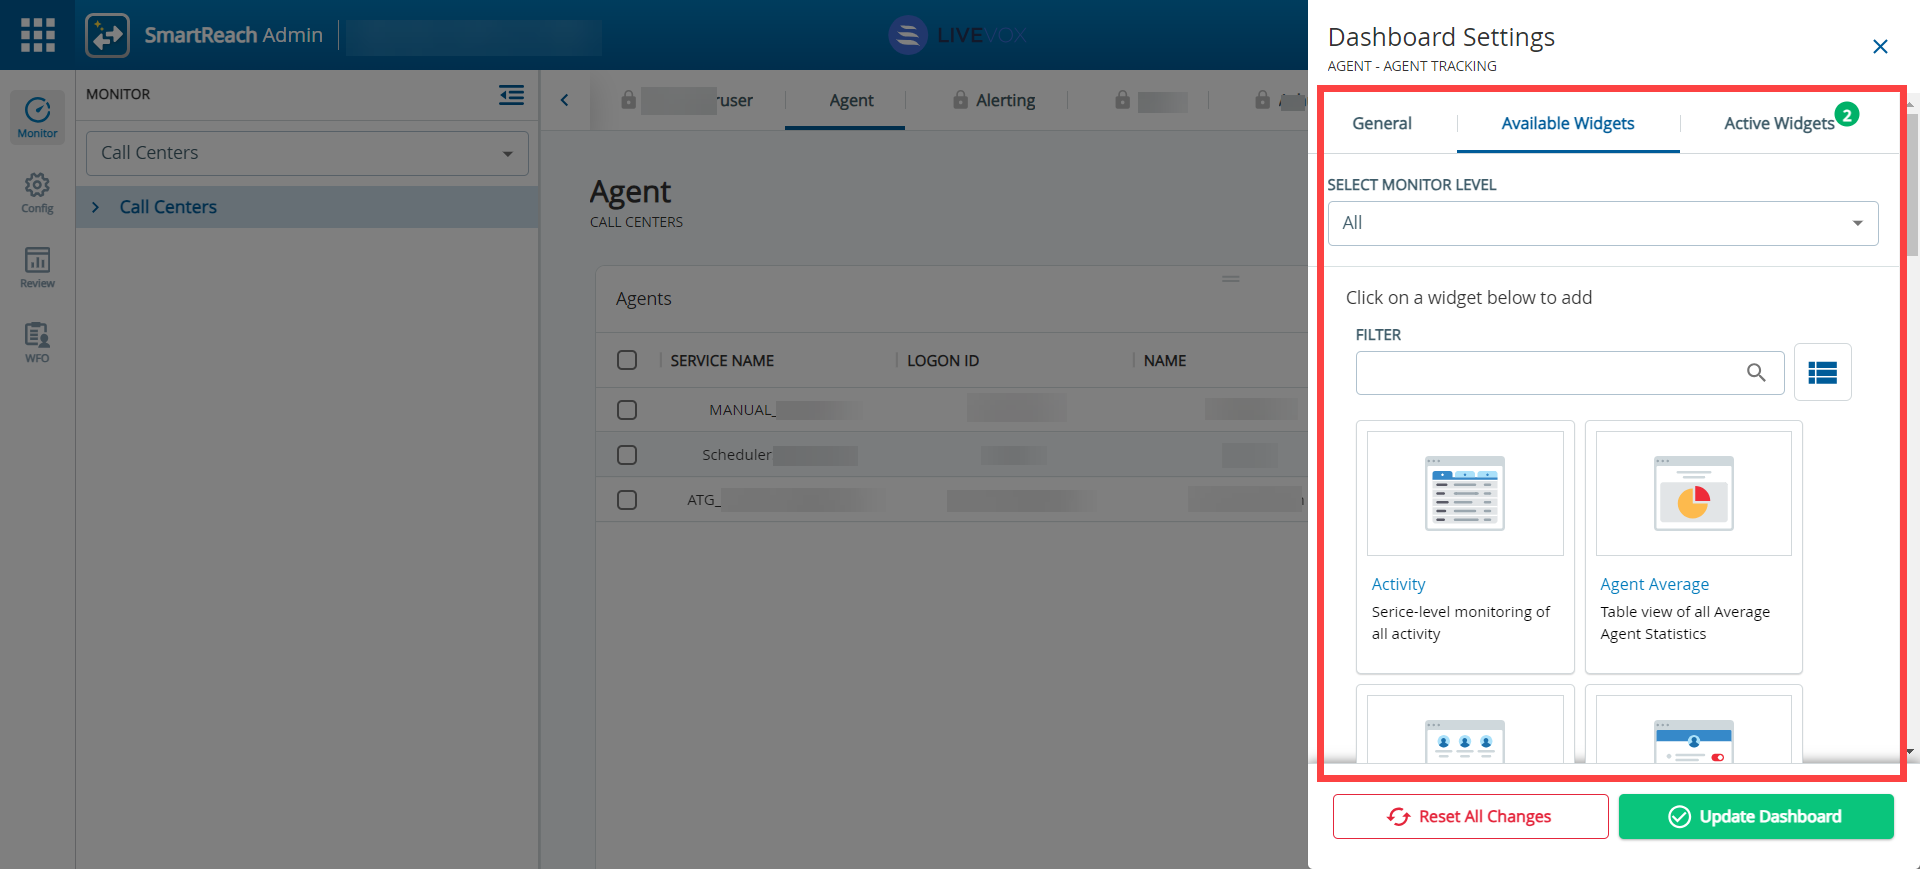
Modify or remove widgets as needed, and choose between Fixed or Dynamic data options. Select the Data Type—Inbound, Outbound, or Blended. Preview widgets before adding them to ensure they meet your requirements, or reset configurations if necessary. Easily drag and resize widgets to create a dashboard that is perfectly optimized for your display.
SLA Management System to Monitor Alerts
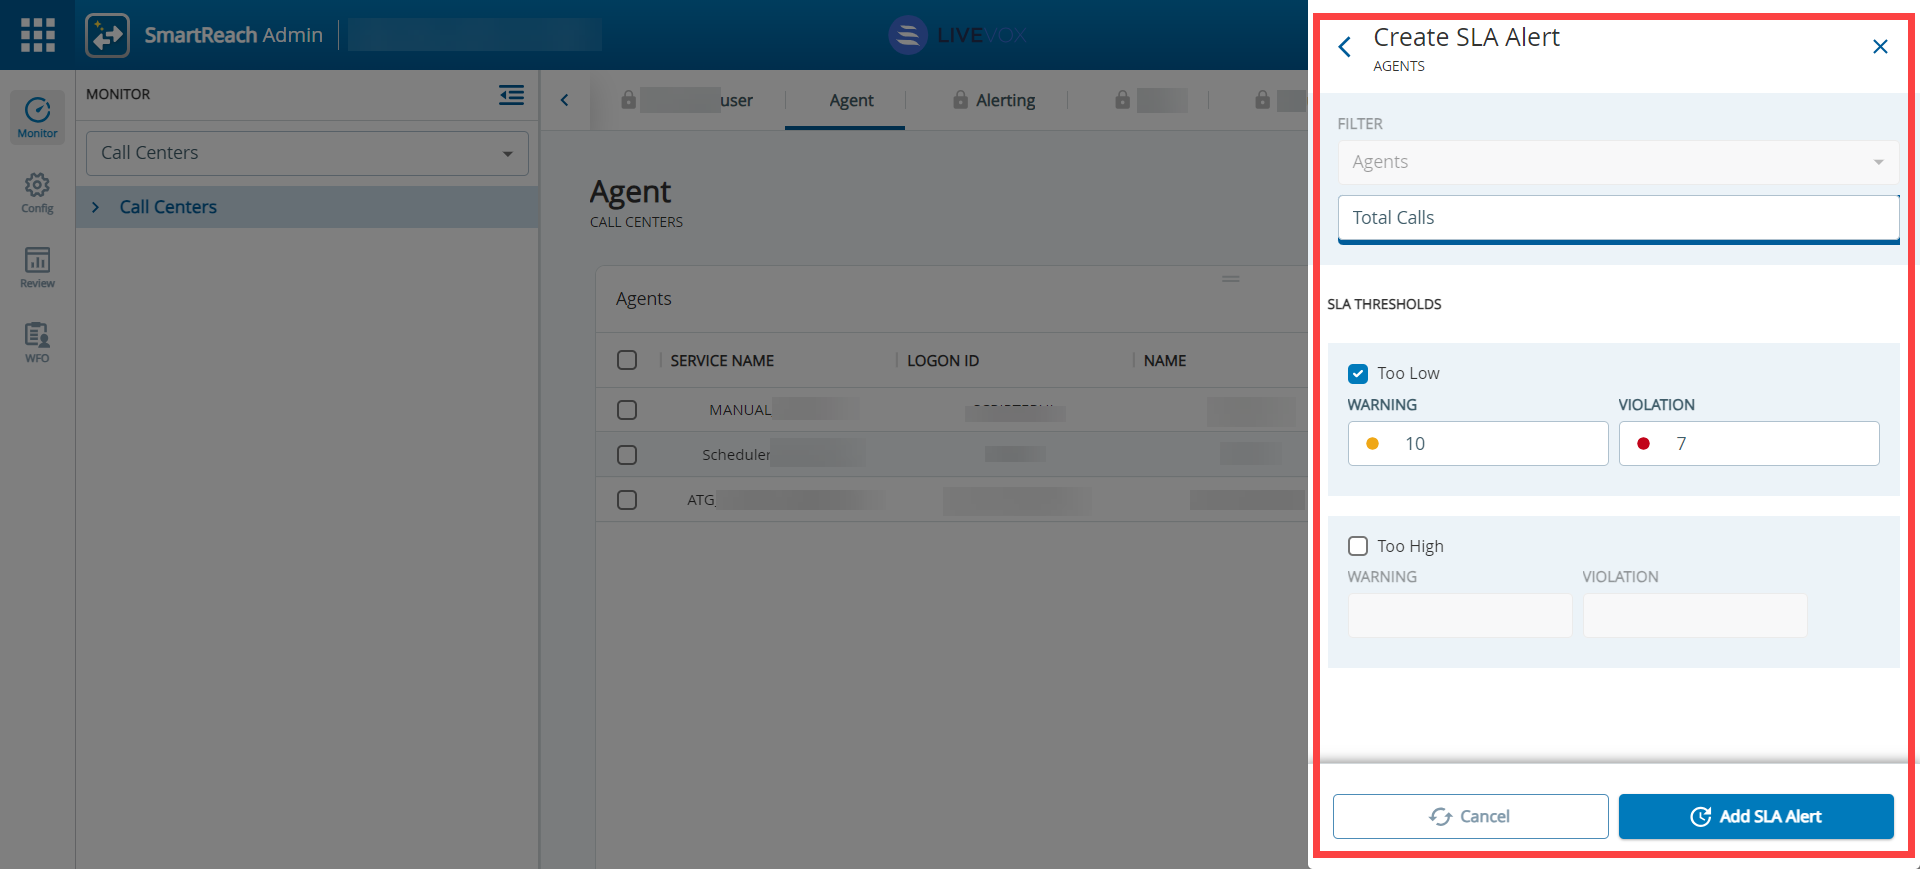
The Monitor Dashboard has been upgraded with an advanced SLA (Service Level Agreement) management system. Previously, users had to manually monitor widgets for real-time alerts when thresholds were reached. With the latest updates, notifications are sent automatically, eliminating the need for constant monitoring.
You can customize the metrics being tracked for each SLA alert, as well as define specific warning and violation thresholds. When a metric reaches these thresholds, a notification is triggered, prompting the necessary action.
You can configure SLA alerts both at the dashboard level and for individual widgets.
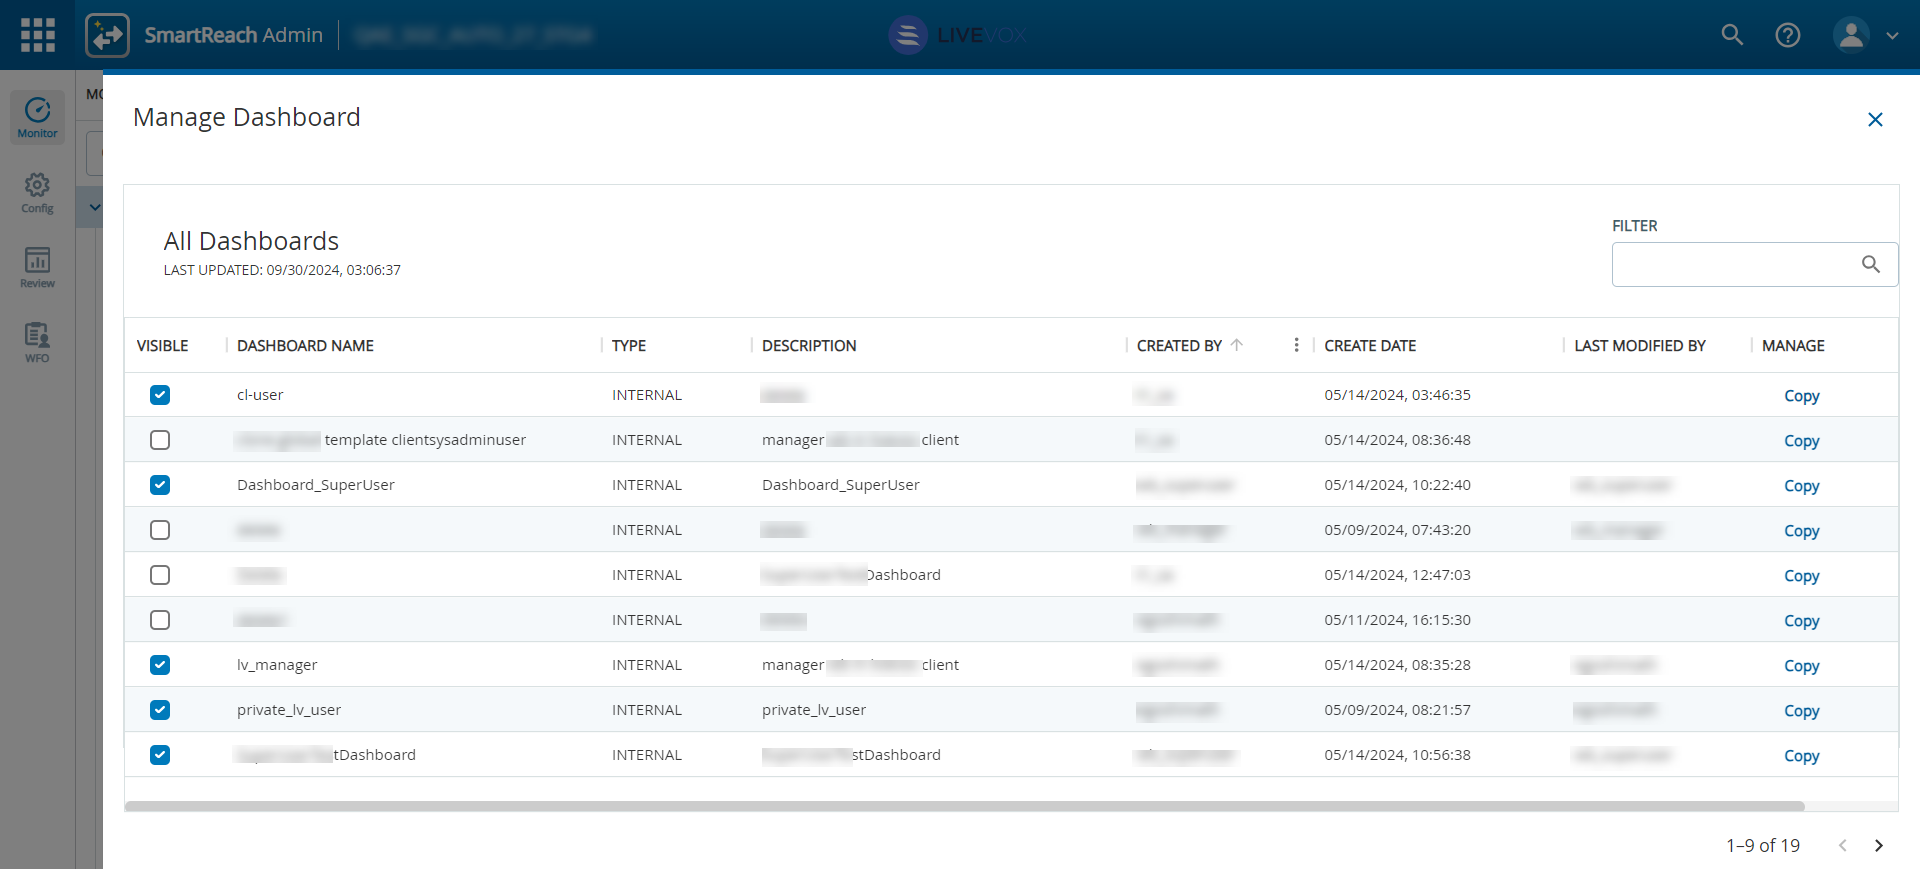
Manage Dashboards
Dashboards you create or those shared with you appear as separate tabs. With the Manage Dashboards feature, you can easily filter and view only the dashboards that matter to you. Simply select the relevant dashboards from the list to customize your view.
