Working with Dashboards
Creating a New Dashboard
You can create a new dashboard on the Monitor tab and add widgets to monitor the data based on your requirements.

Video: Creating a Dashboard
The following video describes the steps for creating a dashboard.
To create a new dashboard:
- Navigate to the Monitor tab.
- Using the drop-down, select the hierarchy level. Choose between Call Centers and Service Groups.
- On the right pane, click
 and click New Dashboard. The Create Dashboard window is displayed.
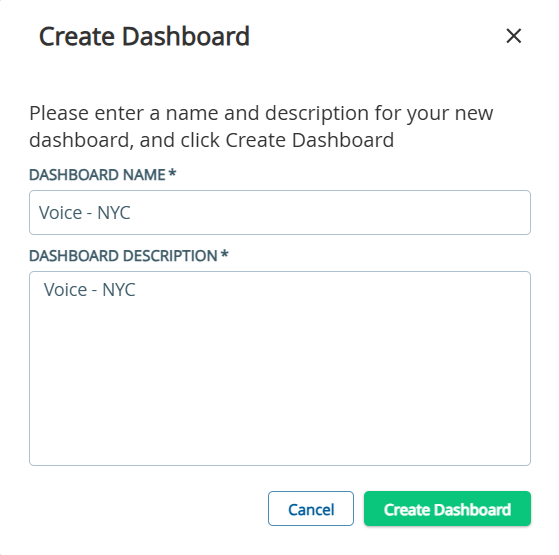
- Specify a Dashboard Name and Dashboard Description and click Create Dashboard. The new dashboard with the specified name is created. Customize the dashboard further by adding necessary widgets and SLA alerts.
Sharing a Dashboard
You can keep the dashboard you have created either private or you can share the dashboard with users in your organization for their use.
To define the visibility:
- Navigate to the Monitor tab.
- Go to the dashboard you have created from the tabs on the right pane.
- Click Dashboard Settings or click the Settings button.
- On the Dashboard Settings pane, click the Share tab.
- Select Personal or Shared using the radio button based on your requirement.
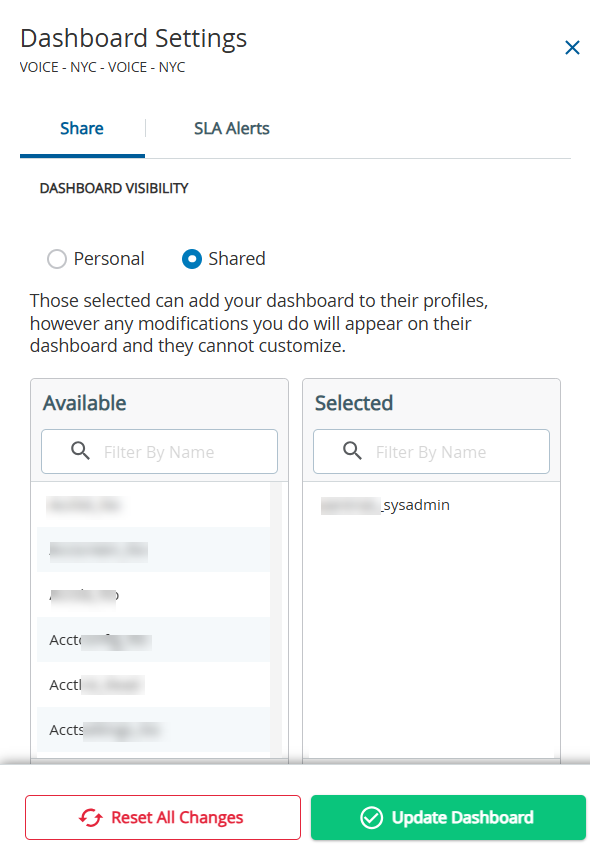
- If you select Shared, specify the users with whom you want to share the dashboard. Select the names from Available column and move them to Selected column.
- Click Update Dashboard.
Adding SLA Alerts
You can add Service Level Agreement (SLA) alerts to your monitor dashboard. Select the monitoring metrics that you want to track and specify the warning and violation levels to create the alert. Once the threshold values mentioned are reached for the chosen metric, a notification is displayed for further action.
To set an SLA alert:
- Navigate to the Monitor tab.
- Go to the dashboard you have created from the tabs on the right pane.
- Click Dashboard Settings or click Settings.
- On the Dashboard Settings pane, click the SLA Alerts tab.
- Click Add SLA Alert. The Create SLA Alert pane is displayed.
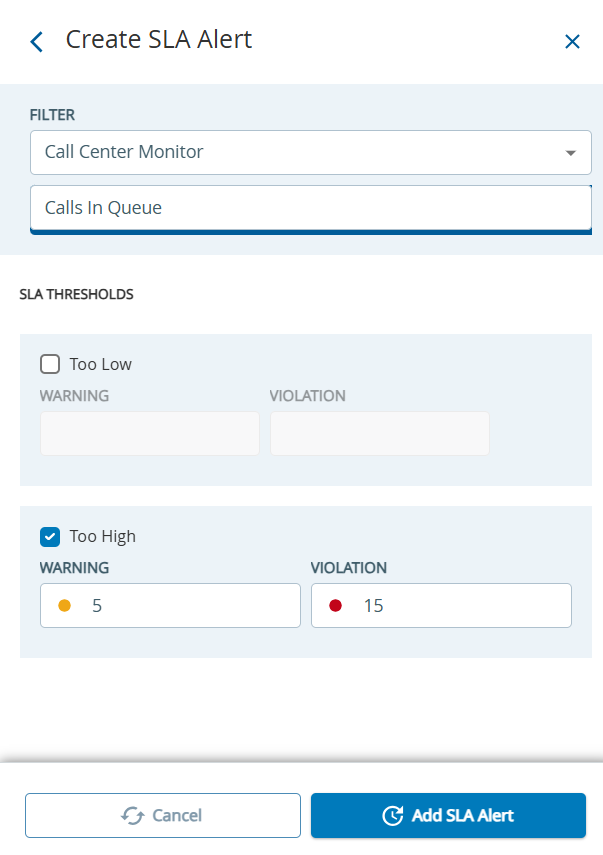
- Select the filter criteria from the drop-down and select the relevant metrics.
- In the SLA Thresholds section, define the thresholds. Set the Warning and Violation thresholds for Too Low and Too High as required.
- Click Add SLA Alert.
- Back on the Dashboard Settings pane, click Update Dashboard.
Cloning a Dashboard
The dashboards you have created can be duplicated or cloned. You can further customize the duplicated or cloned dashboards based on your requirements.
Video: Cloning a Dashboard
The following video shows the steps for creating a dashboard.
To clone a dashboard:
- Navigate to the Monitor tab.
- Go to the dashboard you have created from the tabs on the right pane.
- Click and click Clone Dashboard or click
 . The Clone Dashboard window is displayed.
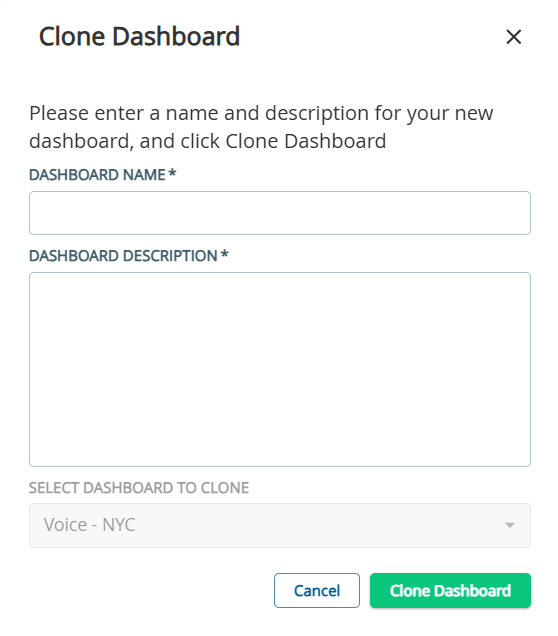
Under the Select Dashboard to Clone, you can choose predefined dashboards 1 to 8 to clone, if the Wallboards feature is enabled for your client portal.
You can select from the following:
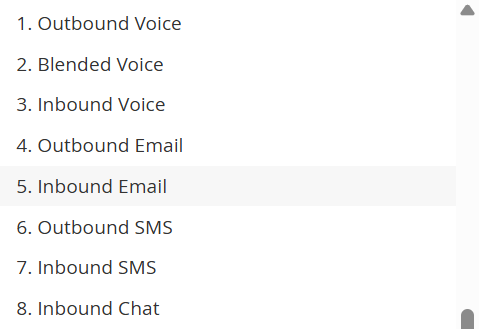
You can then customize the default dashboards as per your requirement. For more information about predefined dashboards, see Default Dashboards.
- Specify Dashboard Name and Dashboard Description and click Clone Dashboard. The new dashboard with the specified name is created.
Customize the dashboard further by adding necessary widgets and SLA alerts.
Managing Dashboards
Dashboards you create or that are shared with you are displayed as separate tabs. The Manage Dashboards feature allows you to quickly filter and view only the dashboards that are most relevant to you.
To manage the dashboards:
- Navigate to the Monitor tab.
- Go to the right pane.
- Click and click Manage Dashboard.
- The Manage Dashboard pane is displayed with details of all the available dashboards.
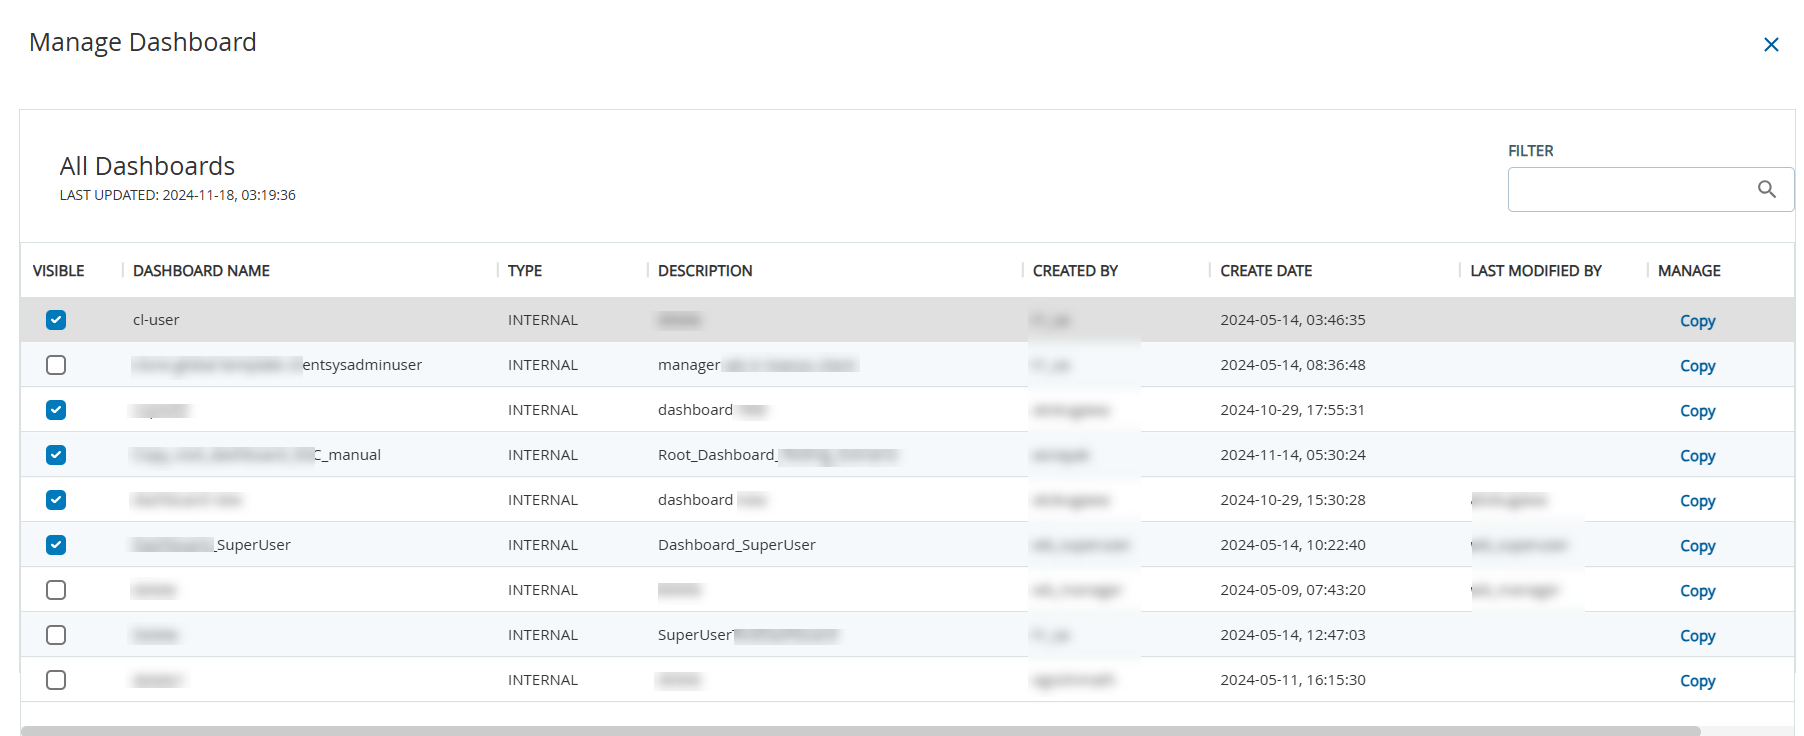
- From the Visible column, select the dashboards you want to view using the checkmark.
- To look for a specific dashboard, use the Filter field.
- Use the Copy link from the Manage column to copy a dashboard.