Default Dashboards
This section describes the predefined or default dashboards, which you can use to create a customized dashboard for your requirements. The default dashboards are numbered 1 thru 8 and are available for you to clone and customize on the SmartReach platform. This functionality is available to the following user roles:
- Sysadmins (enabled by default)
- Superusers (enabled by default)
- Managers (optional - disabled by default)
- The default dashboards appear as below if the Wallboards feature is enabled. For more information about Wallboards see Wallboards.


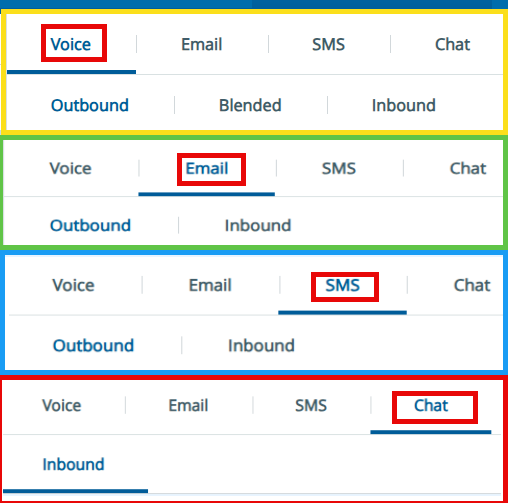
The default dashboards appear as below if the Wallboards feature is not enabled:

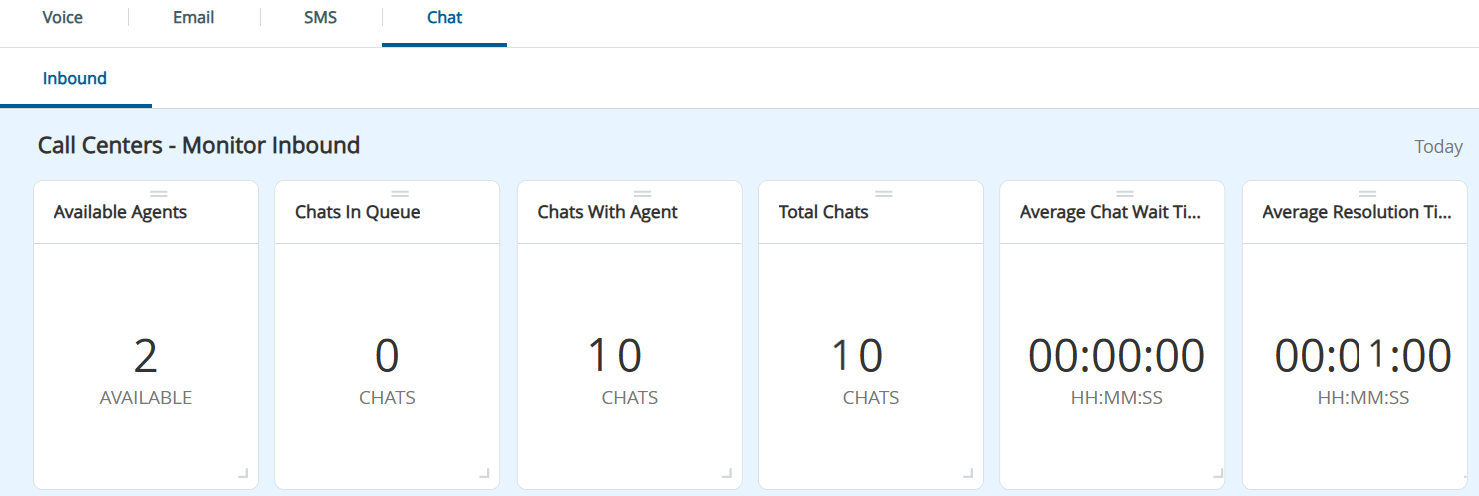
Under the Voice tab you can see dashboards for outbound, blended and inbound voice statistics. Under the Email tab, you can see dashboards for outbound and inbound email statistics. Under the SMS tab, you can see the dashboards for outbound and inbound SMS statistics. Similarly, under the Chat tab, you can see inbound chat statistics.
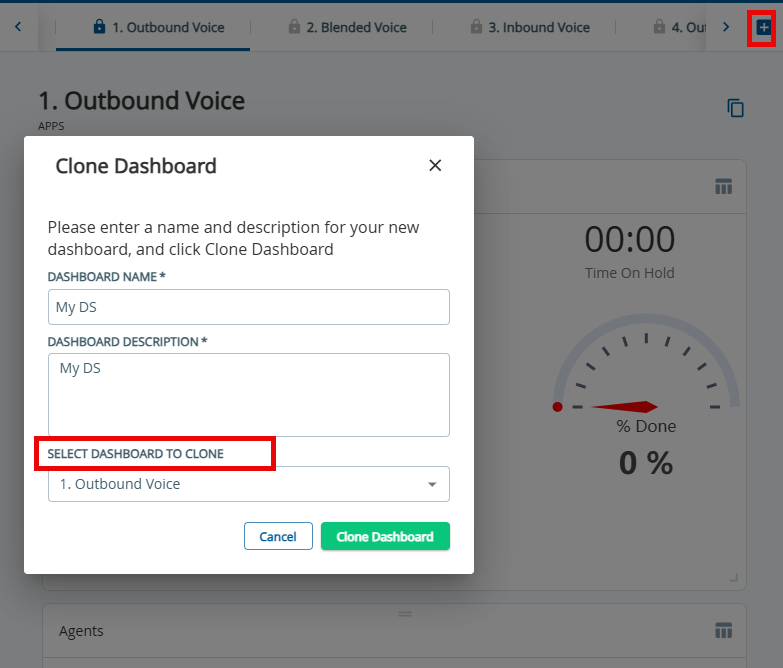
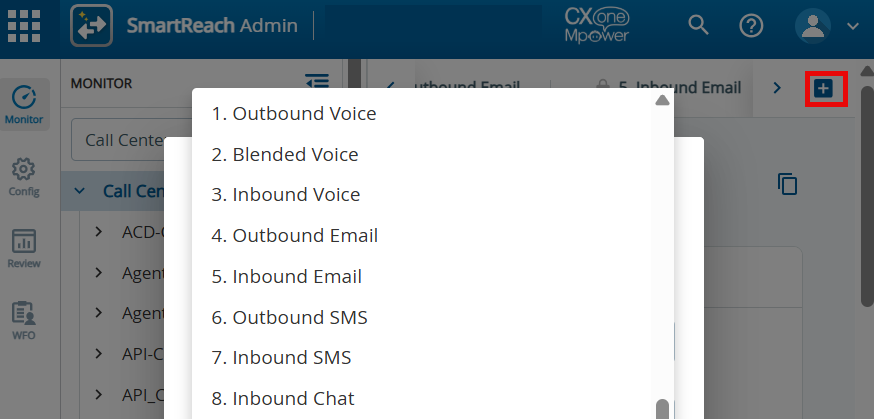
The default dashboards are also visible when you click the  icon on the monitor dashboard screen and select the Clone Dashboard option. You can select the predefined dashboards from the Select Dashboard to Clone drop-down list.
You can clone the default dashboards and make changes to the cloned dashboard. You cannot edit the default dashboards.
- Outbound Voice: The Outbound Voice default dashboard uses the following widgets to help you monitor outbound voice calls:
- Activity (Service) widget: Displays the methods for pacing calls to adjust the rate at which you send calls or messages to your customers for a given period. For example, you can define the pacing method as #Agent allowing agents to manage the call volume, and set the Throttle value to a maximum of 15 calls per agent.
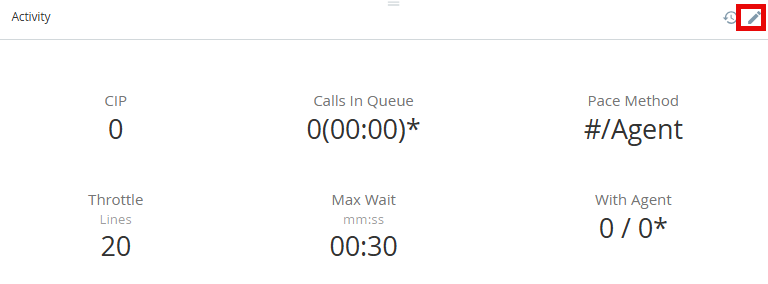
The widget also displays real-time data, such as the number of calls waiting to be handled (Call In Queue). - Costs (Service) widget: Displays the results of calls and the service costs for the current day, including the total cost of all calls made in U.S. dollars. The widget reflects the costs as the number of calls multiplied the rate for each call. It is an estimate only and the invoice you get from your service provider will reflect the exact cost. For example, the Costs widget shows $3.5 for 100 minutes of calls multiplied by 0.035cent (per minute charger by the service provider).
- Hold Queue (Enterprise) widget: Shows all calls on hold in the queue for the enterprise, including details, such as customer phone number, service, and account number.
- Agents (Enterprise) widget: Displays information, such as total talk time, total ready time about all or specific agents in real time for the enterprise.
- Monitor (Enterprise) widget: Displays real time call statistics, such as outbound calls, connected calls for the current day, in real time for the enterprise.
- Outcomes (Enterprise) widget: Displays the real time results of active campaigns, such as connected calls, transferred calls, not connected calls, and right party connect calls.
- Call Center Monitor widget: Displays the real time statistics, such as the number of agents logged in, inbound calls, outbound calls and so on for a call center.
- Campaign (Enterprise) widget: Displays real time information about active and inactive campaigns, such as campaign name, play state, loaded campaigns, and so on.
The screenshot below shows the Campaigns and Hold Queue widgets.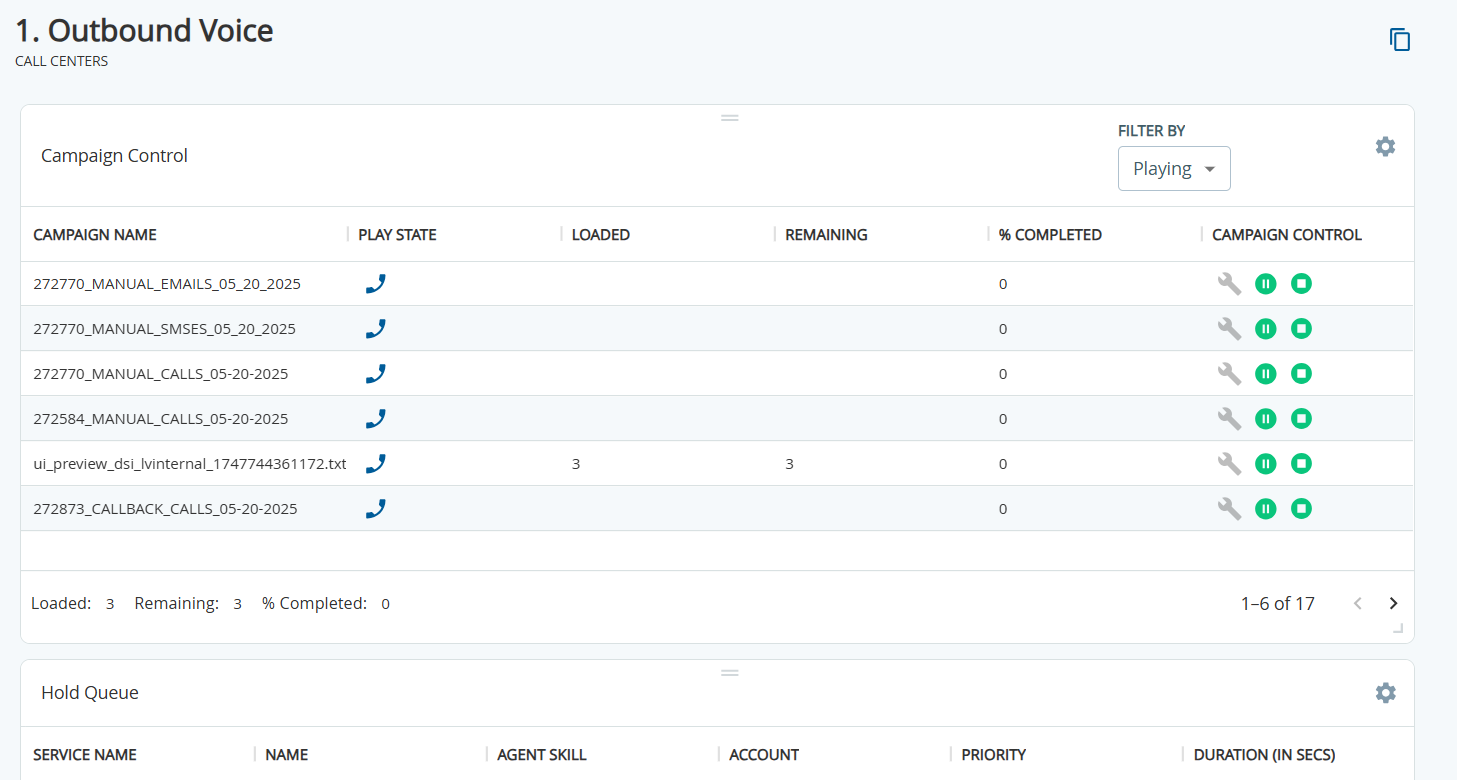
- Activity (Service) widget: Displays the methods for pacing calls to adjust the rate at which you send calls or messages to your customers for a given period. For example, you can define the pacing method as #Agent allowing agents to manage the call volume, and set the Throttle value to a maximum of 15 calls per agent.
- Blended Voice: The Blended Voice default dashboard uses the following widgets to help you monitor blended voice calls:
- Agents (Enterprise) widget: Displays information, such as total talk time and total ready time about all or specific agents in real time for the enterprise.
- Hold Queue (Enterprise) widget: Shows all calls on hold in the queue for the enterprise, including details, such as customer phone number, service, and account number.
- Agent Skills (Enterprise) widget: Displays all Agent Skills details, such as the name of the agent and number of calls in queue for a specific skill at the enterprise level.
- Activity (Service) widget: For example, you can define the pacing method as #Agent allowing agents to manage the call volume, and set the Throttle value to a maximum of 15 calls per agent.
The widget also displays real-time data, such as the number of calls waiting to be handled (Call In Queue). - Campaign (Enterprise) widget: Displays real time information about active and inactive campaigns, such as campaign name, play state, loaded campaigns, and so on for the enterprise.
- Monitor (Enterprise) widget: Displays real time call statistics, such as outbound calls, connected calls for the current day, in real time for the enterprise.
- Call Center Monitor widget: Displays the real time statistics, such as the number of agents logged in, inbound calls, outbound calls and so on for a call center.
- Service Monitor (Service) widget: Displays real time call statistics, such as outbound calls, connected calls for the current day for all the services.
The screenshot below shows the Monitor widget for the blended voice dashboard.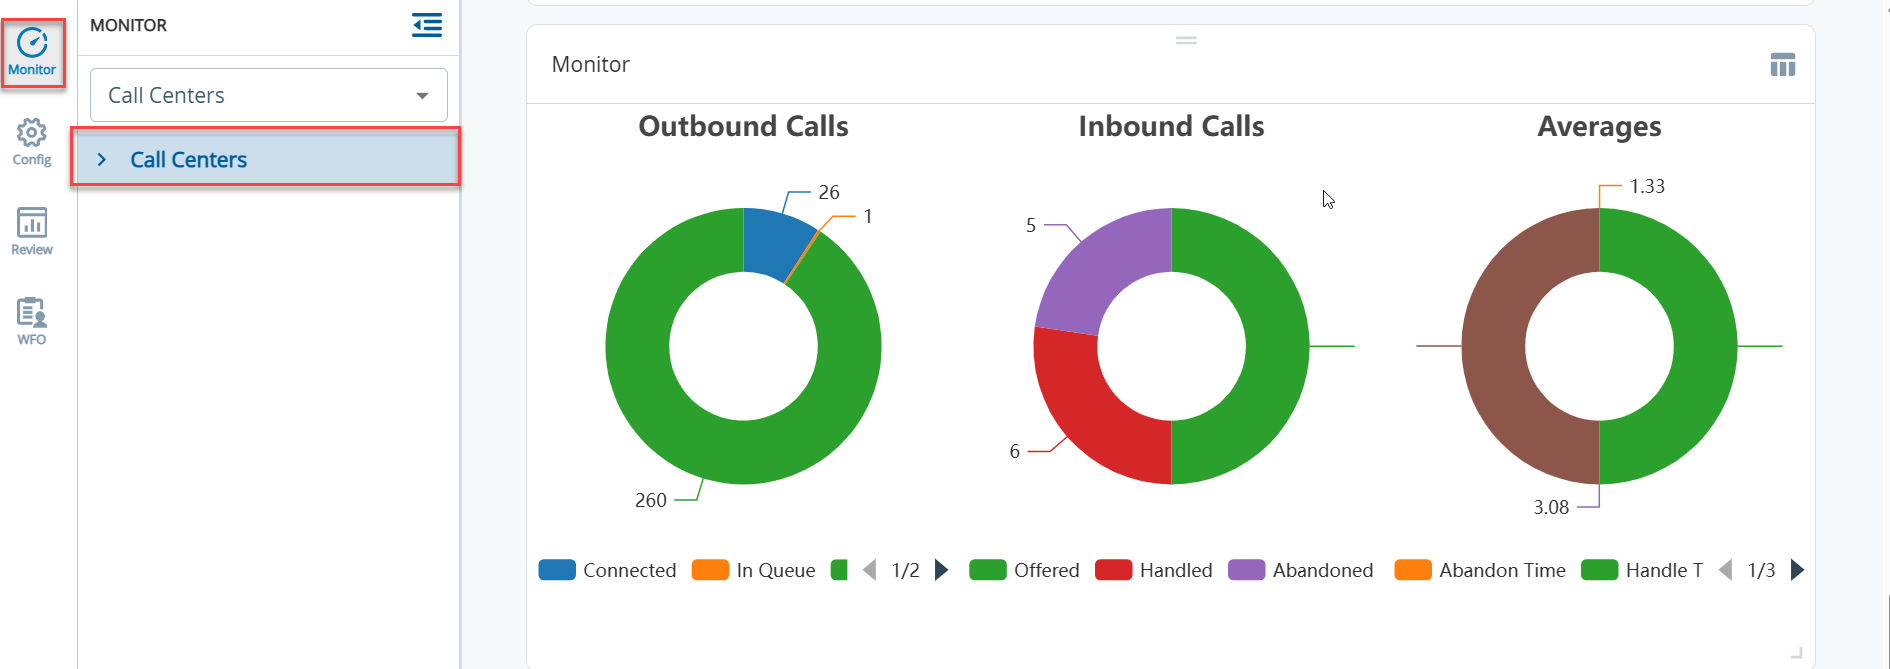
- Inbound Voice: The Inbound Voice default dashboard uses the following widgets to help you monitor inbound voice calls:
- Agents (Enterprise) widget: Displays information, such as total talk time and total ready time about all or specific agents in real time for the enterprise.
- Agent Skills (Enterprise) widget: Displays Agent Skills information, such as the name of the agent, number of calls in queue for a specific skill and so on, at the enterprise level.
- Call Center Monitor widget: Displays the real time statistics, such as the number of agents logged in, inbound calls, outbound calls and so on for a call center.
- Monitor (Enterprise) widget: Displays real time call statistics, such as outbound calls and connected calls for the current day, in real time for the enterprise.
- Activity (Service) widget: For example, you can define the pacing method as #Agent allowing agents to manage the call volume, and set the Throttle value to a maximum of 15 calls per agent.
The widget also displays real-time data, such as the number of calls waiting to be handled (Call In Queue). - Hold Queue (Enterprise) widget: Shows all calls on hold in the queue for the enterprise, including details, such as customer phone number, service, and account number.
- Service Monitor (Service): Displays real time call statistics, such as outbound calls and connected calls for the current day for all the services.
The screenshot shows the inbound monitor dashboard at the call center level.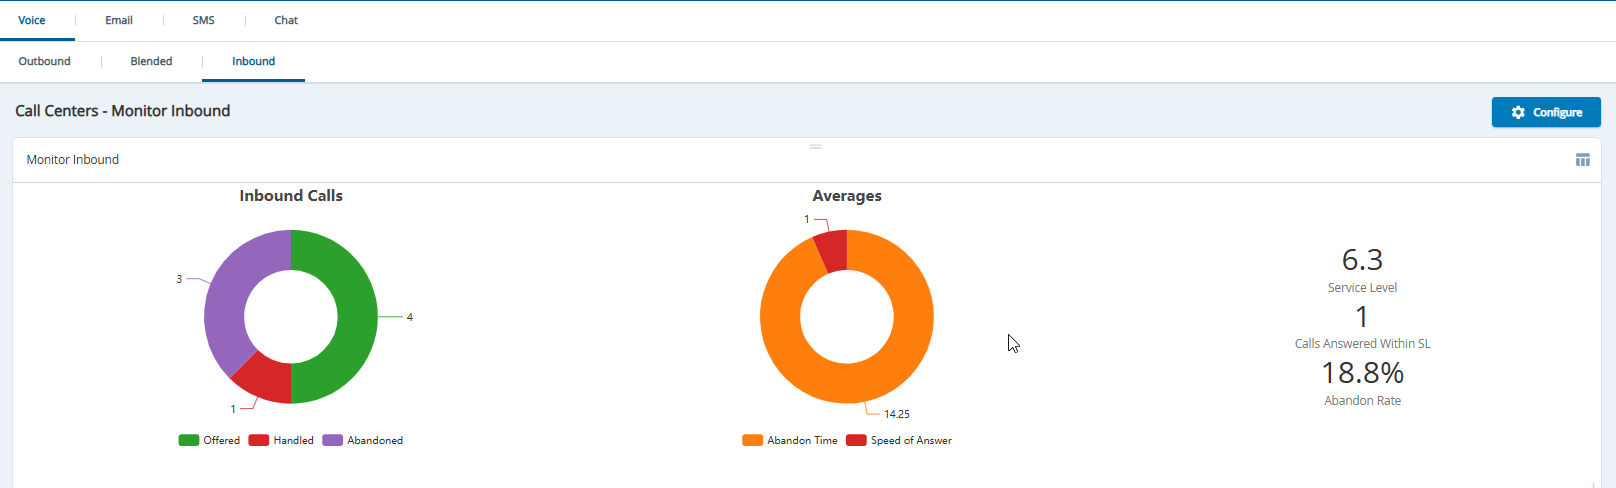
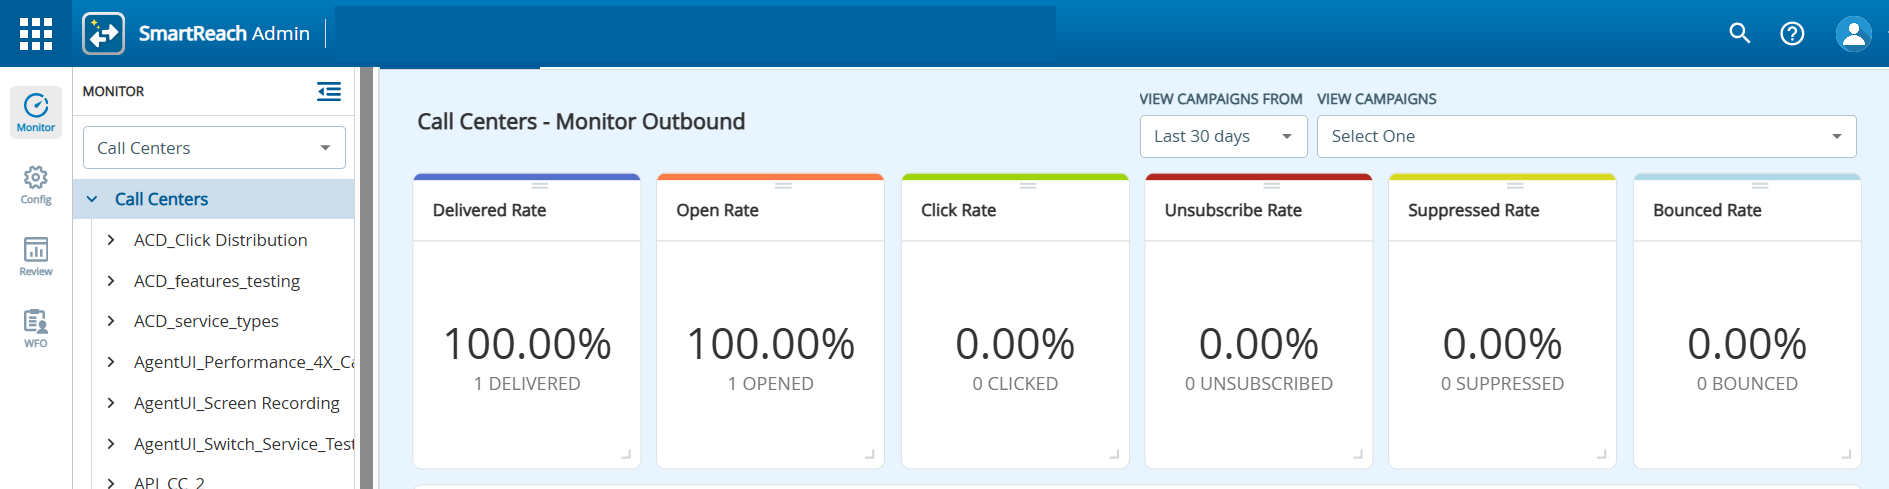
- Outbound Email: The Outbound Email default dashboard uses the following widgets to monitor outbound emails for an enterprise:
- Email Open Rate (Enterprise): Displays the number of emails opened by customers.
- Email Click Rate (Enterprise): Displays the number of email clicked by customers.
- Email Delivered Rate (Enterprise): Displays the number of emails delivered to customers.
- Email Unsubscribe Rate (Enterprise): Displays the number of emails unsubscribed by customers.
- Email Suppressed Rate (Enterprise): Displays the number of suppressed emails by customers.
- Email Bounced Rate (Enterprise): Displays the number of bounced emails from customers.
- Outbound Email (Enterprise): Displays the number of outbound emails sent to customers.
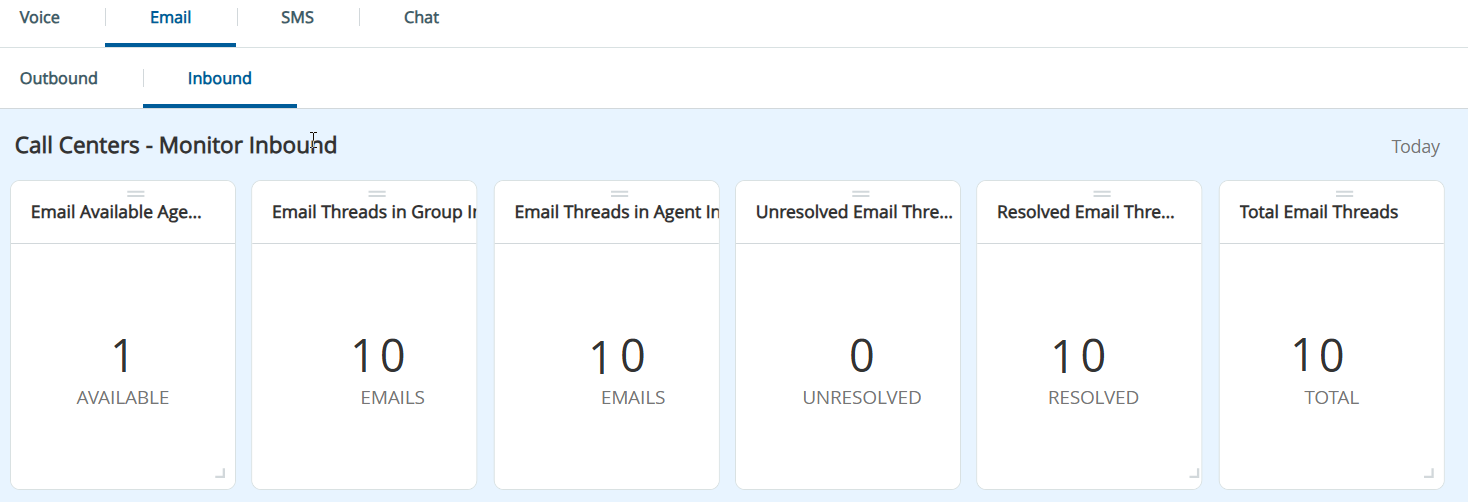
- Inbound Email: The Inbound Email default dashboard uses the following widgets to monitor inbound emails for an enterprise:
- Email Available Agents (Enterprise): Displays the number of agents available to respond to emails.
- Email Threads in Group Inbox (Enterprise): Displays the number of email threads in the agents group inbox.
- Email Threads in Agent Inbox (Enterprise): Displays the email threads in the individual agent inbox.
- Total Email Threads (Enterprise): Displays the total number of email number threads.
- Unresolved Email Threads (Enterprise): Displays the total number of unresolved email threads.
- Resolved Email Threads (Enterprise): Displays the total number of resolved email threads.
- Inbound Emails (Enterprise): Displays the total number of inbound emails.
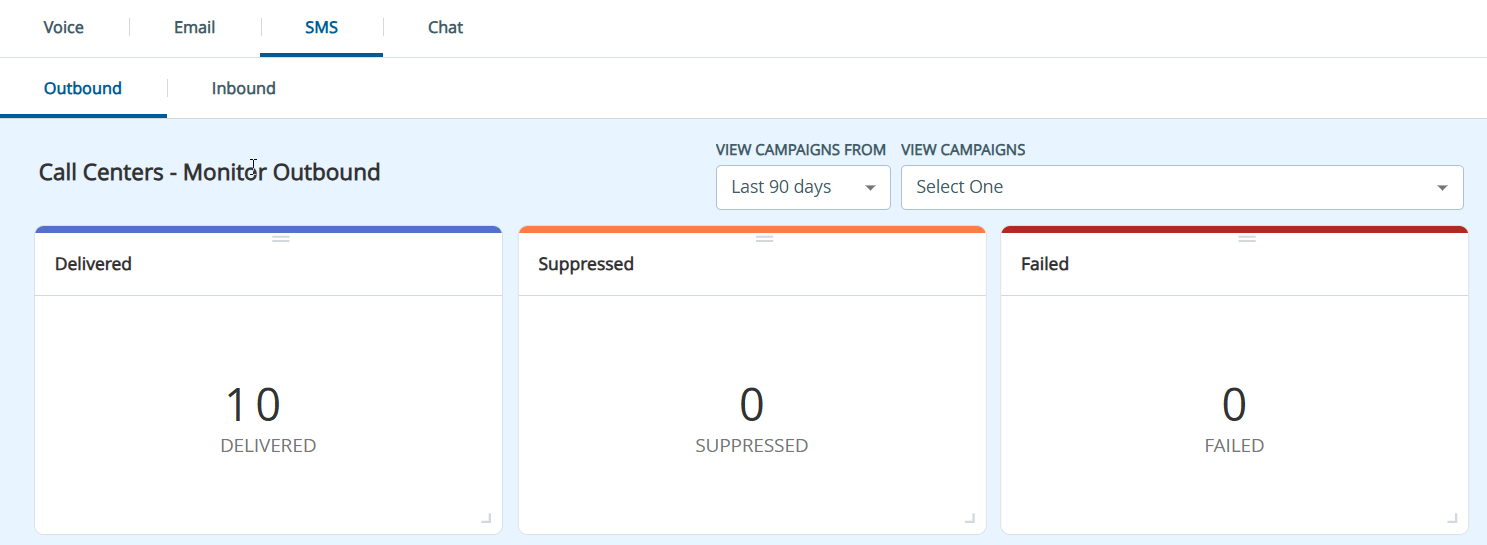
- Outbound SMS: The Outbound SMS default dashboard uses the following widgets to monitor outbound SMSs for an enterprise:
- SMS Failed (Enterprise): Displays the total number of SMSs that failed to be delivered to customers.
- SMS Suppressed (Enterprise): Displays the total number of SMSs suppressed by customers.
- SMS Delivered (Enterprise): Displays the total number of SMSs delivered to customers.
- Outbound SMS (Enterprise): Displays the total number of SMSs sent to customers.
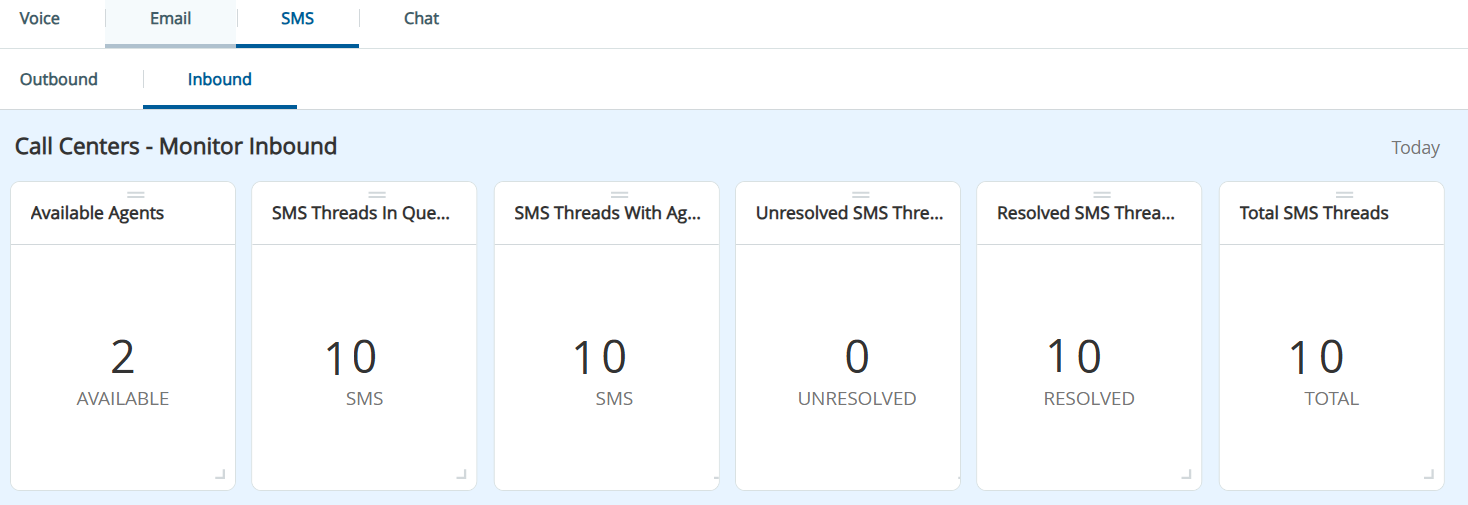
- Inbound SMS: The Inbound SMS default dashboard uses the following widgets to monitor inbound SMSs for an enterprise:
- SMS Available Agents (Enterprise): Displays the total number of agents available for SMS communication with customers.
- SMS Threads With Agent (Enterprise): Displays the total number of SMS threads for an agent.
- SMS Threads In Queue (Enterprise): Displays the total number of SMS threads in queue for all agents.
- Resolved SMS Threads (Enterprise): Displays the total number of resolved SMS threads by all agents.
- Unresolved SMS Threads (Enterprise): Displays the total number of unresolved SMS threads by all agents.
- Total SMS Threads (Enterprise): Displays the total number of SMS threads handled by all agents.
- Inbound SMS (Enterprise): Displays the total number of inbound SMSs handled by all agents.
- Inbound Chat: The Inbound Chat SMS default dashboard uses the following widgets to monitor inbound chats for an enterprise:
- Chats With Agent (Enterprise): Displays the total number of chats with agents.
- Chat Available Agents (Enterprise): Displays the total number of agents available for chat .
- Total Chats (Enterprise): Displays the total number of chats handled by agents at the enterprise level.
- Average Chat Wait Time (Enterprise): Displays the average chat wait time that the customer has to wait to chat with an agent.
- Average Resolution Time (Enterprise): Displays the average resolution time for a chat at the enterprise level.
- Chats In Queue (Enterprise): Displays the total number of chats in queue with agents.
- Inbound Chat (Enterprise): Displays the total number of inbound chats with the agents at the entire level.
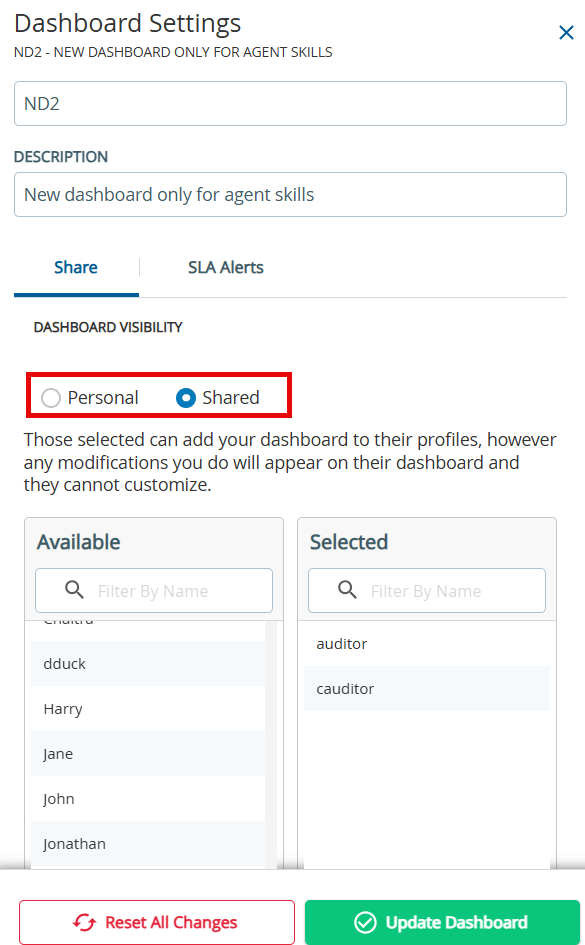
- You can make the default monitoring dashboards visible to other users of the platform.
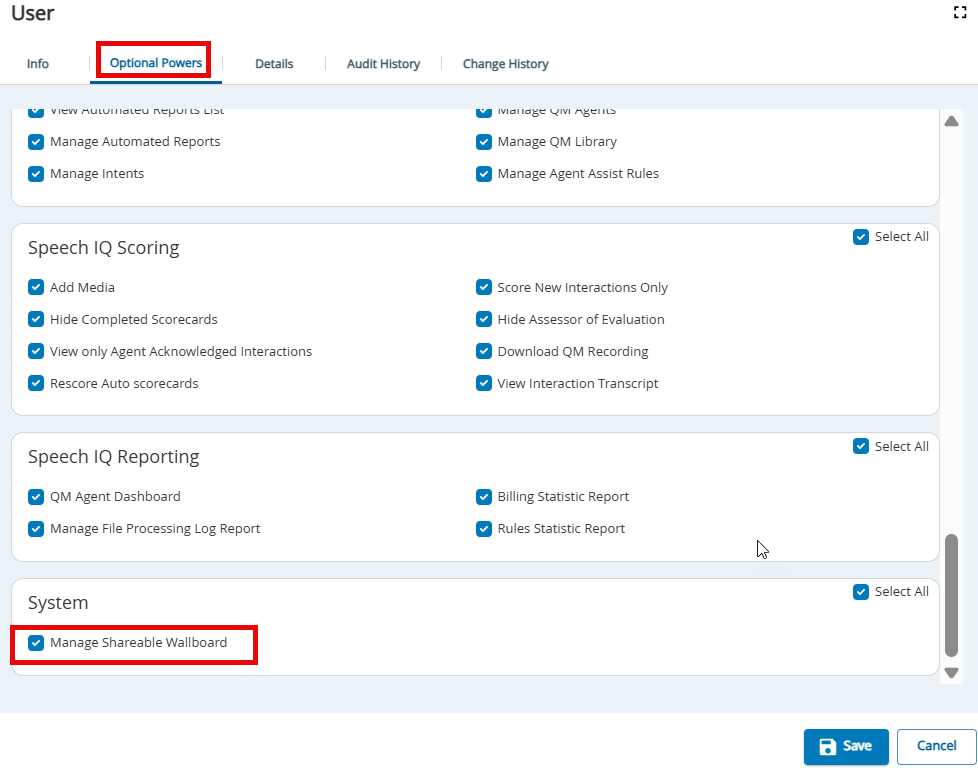
- You can choose to make the dashboard personal or shared.
- Public dashboard creation is available to the following user roles:
- Sysadmin (enabled by default)
- Supersuser (enabled by default)
- IT User (enabled by default)
- Manager (Optional - disabled by default)
- Personal dashboard creation is available to the following user roles:
- Sysadmin(enabled by default)
- Supersuser (enabled by default)
- IT User (enabled by default)
- Manager (enabled by default)
- Auditor (Optional - disabled by default)
- Custom User Role (depends on the given access type)
- Public dashboard creation is available to the following user roles: