The Analytics Dashboard collates and organizes data points regarding call statistics and agent conversion metrics to provide managers a quick overview of the success of their campaigns and a visual representation of campaign results.
The dashboard includes only statistics for completed and reported campaigns. As such, current-day statistics will not include campaigns that are in progress, only the campaigns that have completed their dialing.
The dashboard can be adjusted to track results at the Client level, the Call Center level, and the Service level by selecting the desired level from the top left pane.
Using the tabs at the top of the page, the Analytics Dashboard can also be organized by different time periods. They include:
Today: contains data of completed campaigns today selectable down to the campaign level.
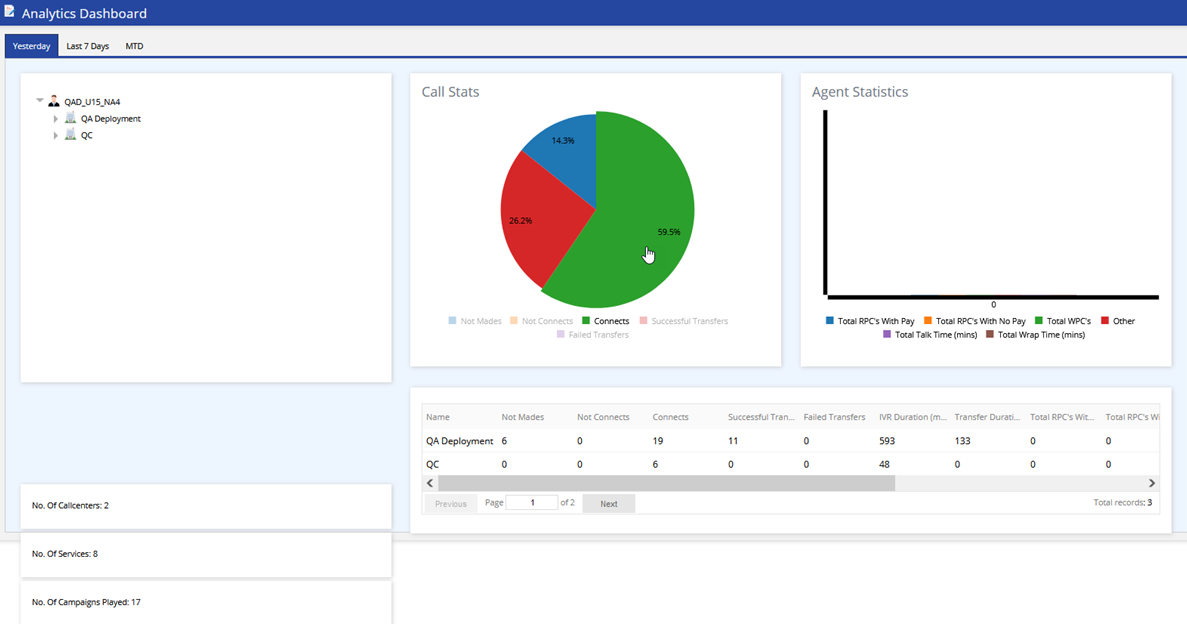
Yesterday: contains data from all campaigns from the prior day selectable down to the campaign level.
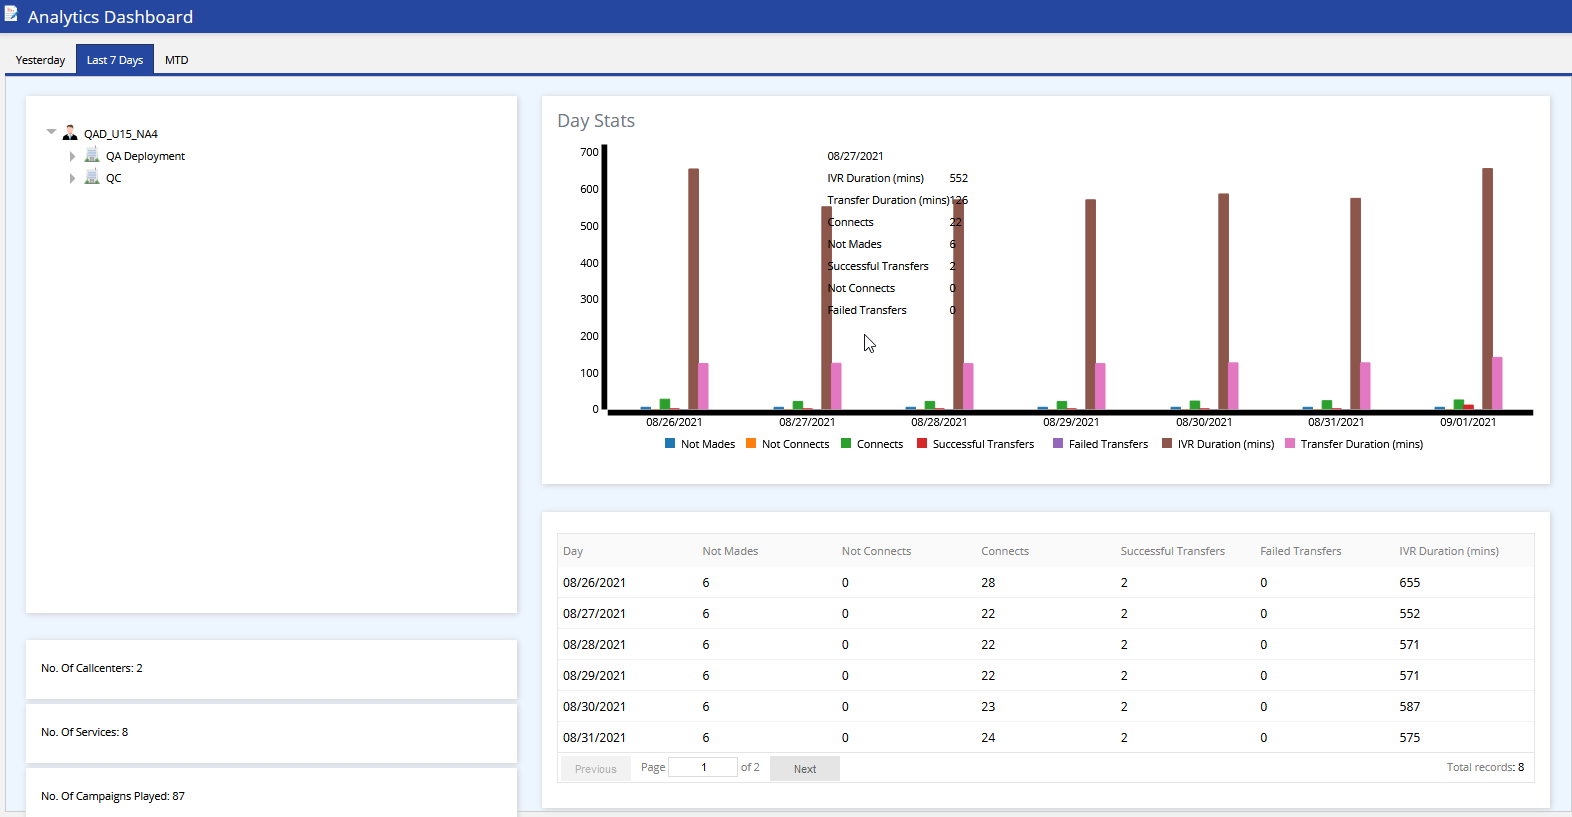
Last 7 days: contains data aggregated by day allowing comparison between days.
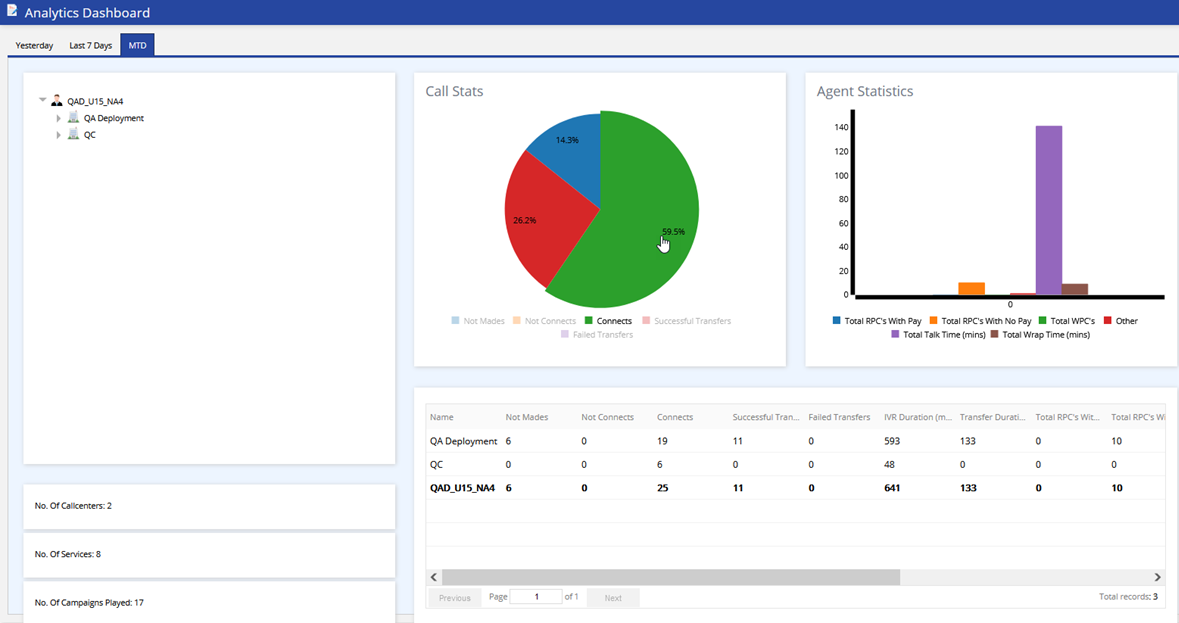
MTD: contains aggregated combined data for the full month to date.
Install a Flash plugin on the browser to view the Call Stats and Agent Stats graphs.
Analytics Dashboard – Yesterday
Analytics Dashboard – Last 7 days
Analytics Dashboard – MTD
From the MTD view, you can view the aggregated data or select specific call centers or services from the top left pane. You can view the individual summary report for a campaign by selecting the campaign name's link to the left of the call statistic data.