Download PDF
Download page Service Efficiency Report.
Service Efficiency Report
This report provides detailed information regarding performance of services or call centers using agent desktop by combining agent level activity with service productivity metrics to determine effectiveness of campaigns.
Search Criteria
To access the Service Efficiency Report, navigate to Review > Campaign Reports > Service Efficiency Report. This takes you to the Service Efficiency Reporting search tool to choose the parameters for the report.
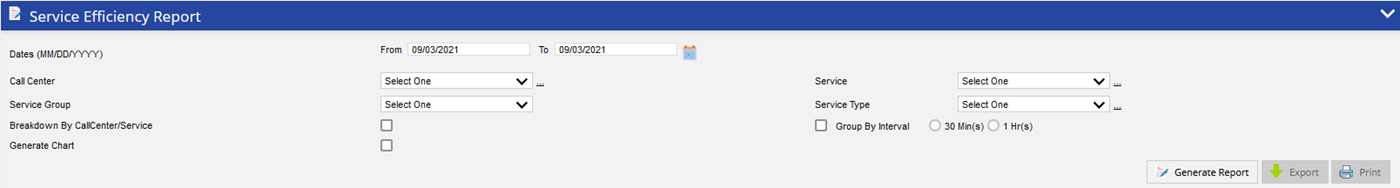
Specify the following options to generate the report. Only date range is required to generate the report and rest of the fields are optional. These optional fields can be used to get the specific records.
- Date Range – Enables you to type in dates in the format of MM/DD/YYYY or choose dates using the calendar button. Clicking on the calendar button opens the Date Picker interface.
- Under the Range tab, you can select the date range.
Under the MultiSelect tab, you can select multiple sequential or non-sequential dates.
- Call Center – Select a call center with a drop-down menu.
- Multiple Call Center Selection –Clicking on the link next to the Call Center drop-down menu opens the Select Call Center window.
- Search the required call center by typing the text in the Search textbox.
- Click a call center from the Available column to move it to the Assigned column.
- Click the Assign All button to add all the available call centers to the Assigned column.
- Click a call center from the Assigned column to remove the assigned call center. It will be moved to the Available column.
- Click the Remove All button to remove all the assigned call centers. They will be moved to the Available column.
- Multiple Call Center Selection –Clicking on the link next to the Call Center drop-down menu opens the Select Call Center window.
- Service – A particular service can be selected using the service drop-down menu. If a particular call center is selected prior to selecting a service, services only available for that particular call center will appear.
- Multiple Service Selection – Clicking on the link next to the Service drop-down menu will open the Service Selection window:
- Search the required Service by typing the text in the Search textbox.
- Click a service from the Available column to move it to the Assigned column.
- Click the Assign All button to add all available services to the Assigned column.
- Click a service from the Assigned column to remove it from the assigned services. It will be moved to the Available column.
Click the Remove All button to remove all the assigned services. They will be moved to the Available column.
- Multiple Service Selection – Clicking on the link next to the Service drop-down menu will open the Service Selection window:
Service Group - Service Group is the system that defines which outbound services agents should be logged into to receive the calls from inbound services as well as outbound blending. Further details are available from the Service Grouping section. Adding the ability to group the reports’ metrics based on the Service Group allows better visibility into the agents’ efficiency across all services (including inbound) they may have been working.

The SG selection will only appear in the search window if there is existing SG (s). Otherwise, the option will be hidden.
- Service Type -Allows you to select a particular service type using the Service Type drop-down menu. If a particular service type is selected, only the services available for that service type appear in the Services drop-down list.
- Multiple Service Selection – Clicking on the link next to the Service Type drop-down menu opens the Select Service Type window:
- Search the required service type by typing the text in the Search textbox.
- Click a service type from the Available column to move it to the Assigned column.
- Click the Assign All button to add all available service types to the Assigned column.
- Click a service type from the Assigned column to remove it from the assigned service types. It will be moved to the Available column.
- Click the Remove All button to remove all the assigned service types. They will be moved to the Available column.
- Multiple Service Selection – Clicking on the link next to the Service Type drop-down menu opens the Select Service Type window:
- Breakdown by Call Center/Service– The setting allows the breakdown of each call center’s activity rather than just a total for the enterprise.
- Group by Interval – The setting allows you to take one service and break out a single day worth of data into 30 minute or 1 hour intervals. Only one service and one day of data can be generated when the Group by Interval is selected.
- Generate Chart – Provides a graphical view of key metrics found in the Service Efficiency Report.
Generate Report and Results
Report columns and sequences can be easily modified to provide you with a report view that is important to your business operation.
Column Customization
To customize columns:
- Click the cog icon in the upper-right of the Results panel. You are presented with the Customize Column window.
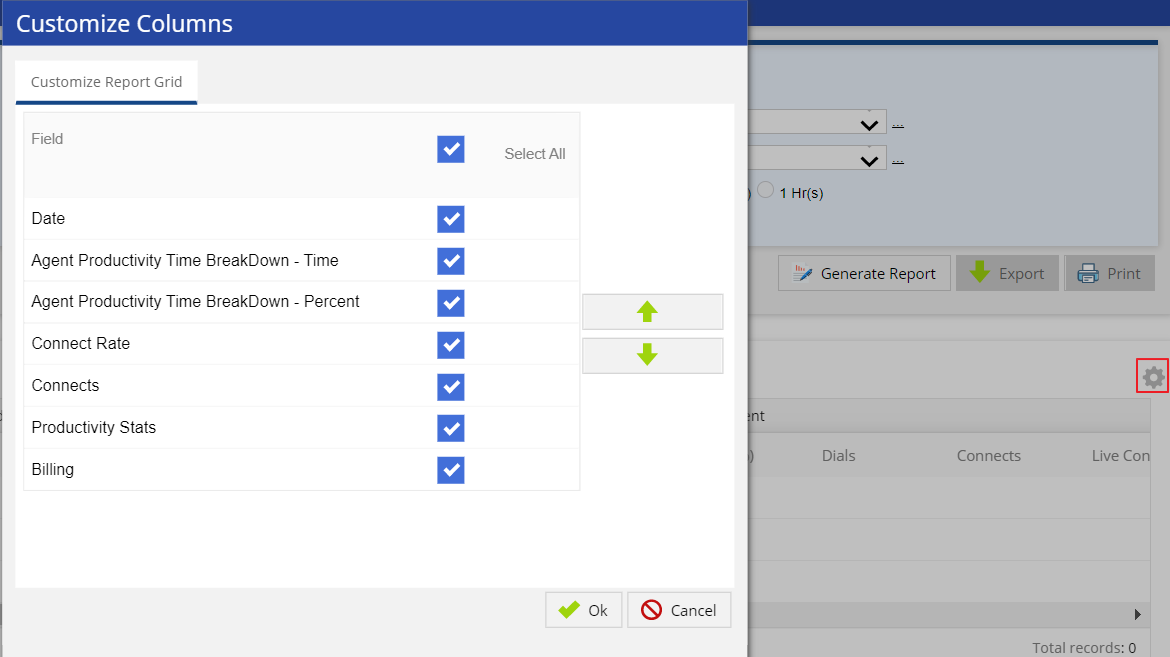
- Place a checkmark to the right of the field you want to be displayed and unchecked for those to be hidden. See below the Generate Report section for more information on available fields in the report.
- Re-sequence the displayed fields by selecting a column and moving it up or down using the appropriate button.
- Click OK to update the view.
Generate Report
After choosing the search parameters, generate the report by clicking the Generate Report button to the right of the search options. The report generates with following distinct data categories as well as charts:
- Agent Productivity
- Connect Rate
- Connects
- Productivity Stats
- Billing
Agent Productivity
It provides aggregated agent level productivity metrics for the parameters requested within the report
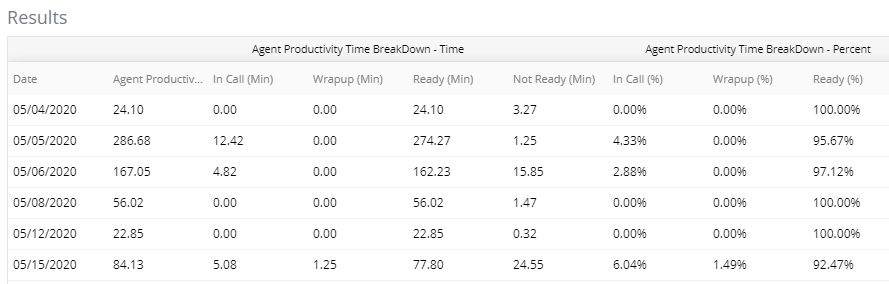
The Agent Productivity Time BreakDown - Time section provides aggregated agent level productivity metrics for the parameters requested within the report.
- Date: The date the data represents
- Agent Productive Time (Min): Total time in minutes the agents spent in an “In Call”, “Wrap Up’, or “Ready” state
- In Call (Min): Total time in minutes all agents were “In Call” state
- Wrap Up (Min): Total time in minutes all agents were “Wrap Up” state
- Ready (Min): Total time in minutes all agents were “Ready” state
Not Ready (Min): Total time in minutes all agents were in “Not Ready” state
The Agent Productivity Time BreakDown - Percent section provides aggregated agent level productivity metrics for the parameters requested within the report.
- In Call %: Total amount of time the agents spent “In Call” state divided by the Agent Productive Time
- Wrap Up %: Total amount of time the agents spent in a “Wrap Up” state divided by the Agent Productive Time
- Ready %: Total amount of time the agents spent in “Ready” state divided by the Agents Productive Time
When Group by Interval is selected the totals may slightly differ due to the way the intervals are rounded.
Connect Rate
It provides service or call center level aggregated data.
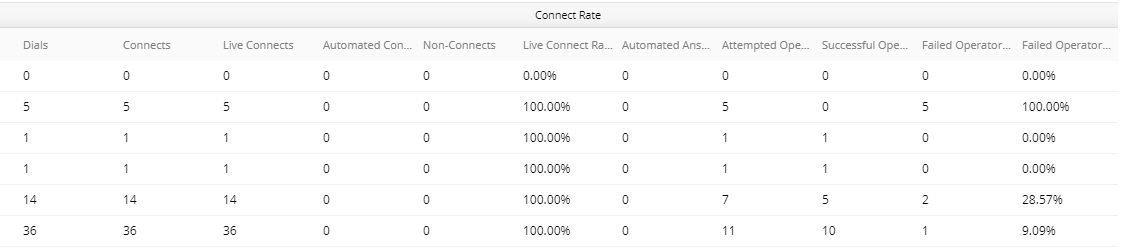
- Dials: Total attempted calls
- Connects: Total number of calls connected to a live party or machine (answering machine, fax, etc)
- Live Connects: Total connected calls answered by a live person
- Automated Connects: Total connected calls answered by a machine (fax or answering machine)
- Non-Connects: Total calls not connected
- Live Connect Rate: Live Connects divided by Dials
- Automated Answering Machine Left Message: Total connected calls resulting in a “Machine, Left Message’” result code
- Attempted Operator Transfers: Total calls the LiveVox system attempted to transfer to an agent
- Successful Operator Transfers: Total number of operator transfers that successfully connected to an agent
- Failed Operator Transfers: Total number of operator transfers that failed to connect to an agent
- Failed Operator Transfer Rate: Failed operator transfers divided by attempted operator transfers
Connects
The Connects section distinguishes the type of connects achieved during the dialing period based on agent-selected disposition code.
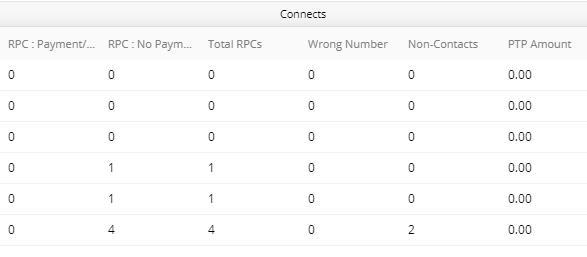
- RPC: Payment/ PTP: Total calls with a result code of RPC with Payment Arranged
- RPC: No Payment/ PTP: Total calls with a result code of RPC with No Payment Arranged
- Total RPCs: Total of both RPC with Payment Arranged and RPC with No Payment Arranged result codes
- Wrong Number: Total calls with a result code of Wrong Party Connect (WPC)
- Non-Contacts: Total of calls coded as a Non-Contact
- PTP Amount: Total amount of PTP dollars collected by the agents (Ex: 200.00)
Productivity Stats
This section provides production level productivity metrics.
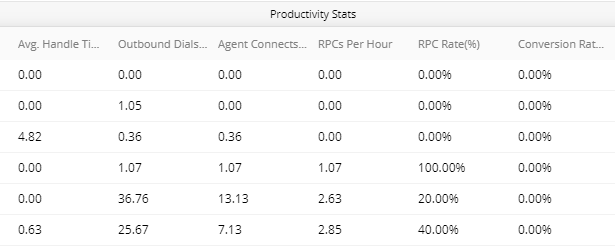
- Average Handle Time (Mins): Total amount of In Call minutes plus "Wrap Up" minutes divided by the total number of Successful Operator Transfers.
- Outbound Dials per Hour: Total Dials divided by the Agent Productive Time in hours (Agent Productive Time Minutes divided by 60 minutes)
- Agent Connects per Hour: Total amount of Successful Operator Transfers divided by Agent Productive Time in hours
- RPCs per Hour: Total RPCs divided by total Agent Productive Time in hours
- RPC Rate: Total RPCs divided by Successful Operator Transfers
- Conversion Rate (%): Total PTPs divided by Total RPCs
Billing
This section provides additional billing metrics specific to the parameters requested within the report.
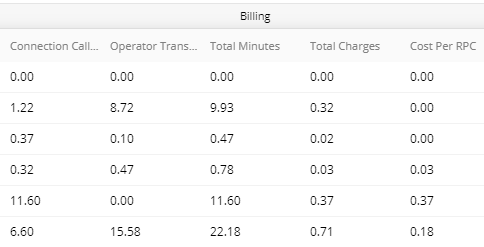
- Connection Call Mins: Total duration of connected calls displayed in minutes
- Operator Transfer Minutes: Total duration of operator transfer calls displayed in minutes
- Total Minutes: Total Connected Minutes plus Total Operator Transfer Minutes
- Total Charges: Total Minutes multiplied by the Cost per Minute
- Cost per RPC: Total Charges divided by Total RPCs
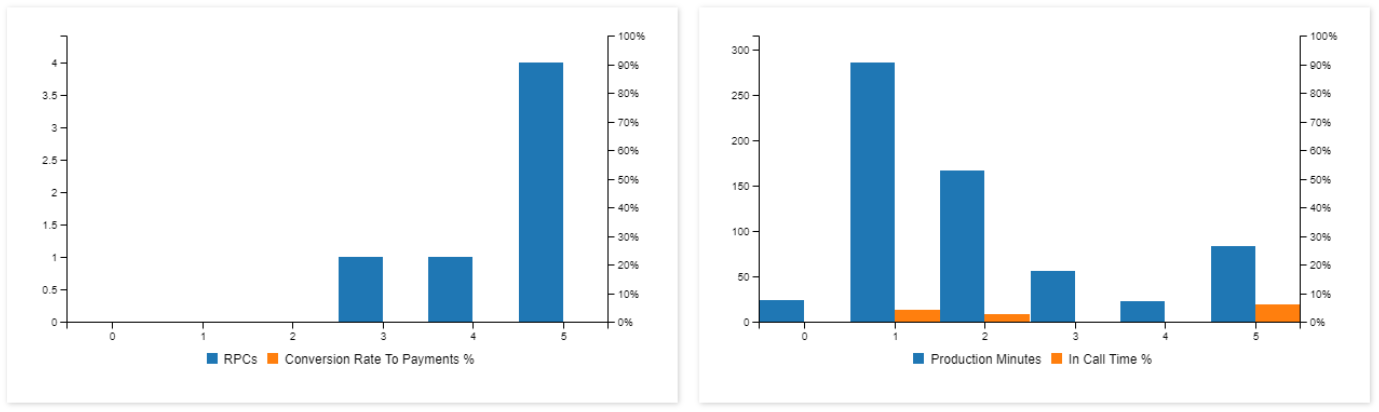
Generate Charts
This option provides a graphical view of key metrics found in the service Efficiency Report. Charts are generated by selecting the Generate Chart checkbox.
- Production Minutes v/s RPC rates (l) and dials v/s failed operator transfer rates
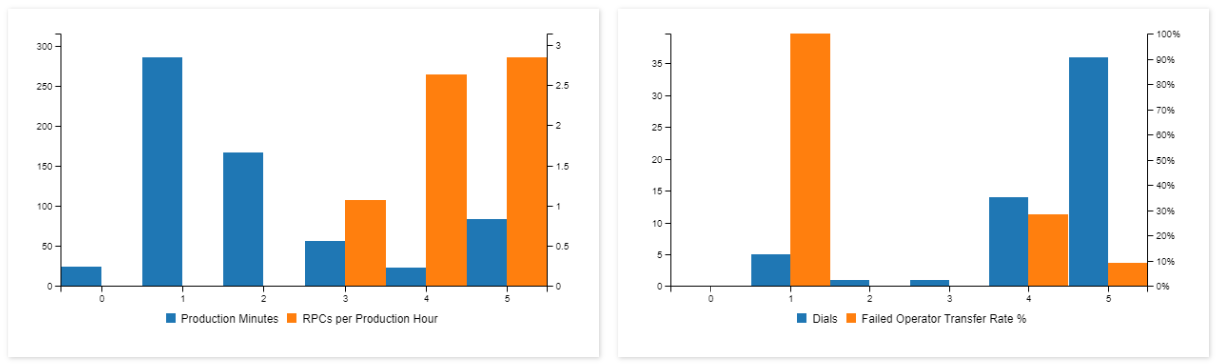
- RPCs v/s payment promises (l) and product minutes v/s In Call time
Additional Buttons
- To export the generated report, click the Export button (next to the Generate Report button) and select the required option of file type. The available options are PDF, Excel, CSV.
- To print the generated report, click the Print button (next to the Export button). The generated report opens in another tab. Select the details for printing the report and click the Print button.