Download PDF
Download page Inbound Efficiency Report.
Inbound Efficiency Report
You can use the Inbound Efficiency Report to view key performance indicators (KPIs) pertaining to inbound calls.
- You can generate this report for a time period that is not more than 31 days. If you want to generate a report for an additional time period, contact the LiveVox Customer Care Team.
You can generate the report only up to the last 90 days from the current date.
- All the time values in the report are represented in Eastern Standard Time.
- The report is available to the following user roles with access to the inbound service:
- Auditor
- SysAdmin
- Super User
- Report Viewer
- Manager
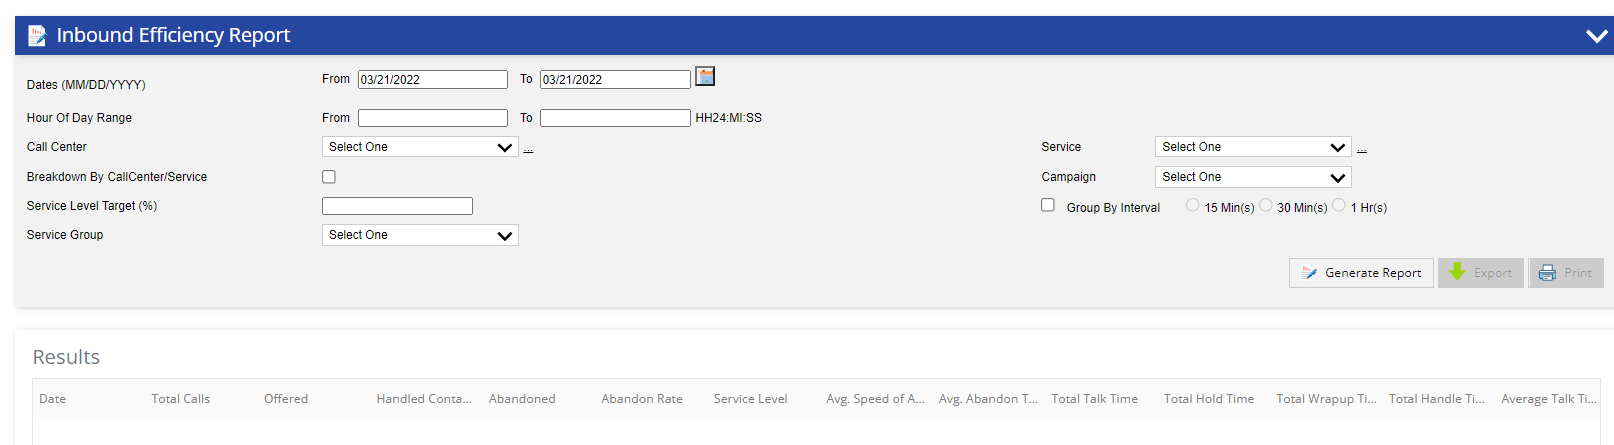
Search Criteria for Generating the Report
The Inbound Efficiency Report window contains the following fields, which you can use to specify the criteria for generating the report.
| Field | Description |
|---|---|
| Dates (MM/DD/YYYY) | This field enables you to specify the date range for the report. It contains the following subfields:
The field also contains the calendar icon (
|
| Hour Of Day Range | This field enables you to specify the time period for each day in the date range for the report. It contains the following subfields:
The time in the subfields is represented in the 24-hour time notation, in the following format: HH:MM:SS. where HH is hours, MM is minutes, and SS is seconds. If you do not specify a value in the subfields, the start time and the end time are considered to be 04:00:00 and 03:59:00, respectively. |
| Call Center | This field enables you to specify the call center for the report. To add multiple call centers:
|
Service | This field enables you to specify only the inbound and blended services for the report. If you have already specified a call center, only the inbound and blended services that are available for the specified call center appear in this field. To add multiple services:
|
| Breakdown by Call Center/Service | This checkbox allows the breakdown of each call center's activity as opposed to the total for the enterprise, in the report. |
| Group By Interval | This checkbox enables you to divide the entire data of a day into a 15-minute, 30-minute, or 1-hour intervals. It contains the following options, which you can select if you select this checkbox:
If you select the checkbox, data pertaining to only one day is considered when generating the report. |
| SL Target (%) | SL (Service level) Target (%) is the targeted percentage of inbound calls that are answered or abandoned within a defined time threshold. The value in this field is critical for managing inbound traffic.
If you specify a value in this field, the service level percentage that is less than the specified value appears in red in the report you generate. |
| Campaign | This field enables you to specify a campaign for the report. |
| Service Group | Service Group is a system that defines the outbound services to which agents must be logged on to receive calls from inbound services and outbound blending services. Grouping the metrics in a report based on a Service Group allows you better visibility into an agent's efficiency across all the services (including inbound) in which they are engaged. You can specify a value in this field only if a Service Group exists. |
Generate Report
To generate the Inbound Efficiency Report, click Generate Report. The report generates the following data after the calls or web chat conversations are fully reported:
| Column | Description |
|---|---|
| Date | Date when the call was launched. |
| Total Calls | Count of connected calls. |
| Offered | Count of attempted transfers to agents. |
| Handled Contact Number | Count of calls transferred to agents. |
| Abandoned | Count of calls that failed to transfer to agents. |
| Abandon Rate | Percentage of abandoned calls (that is, (Abandoned / Offered) * 100). |
| Service Level | ((Count of calls answered within the time threshold + Count of calls abandoned within the time threshold) / Offered) * 100
|
| Avg. Speed of Answer (ASA) | Call hold duration / Offered. |
| Avg. Abandon Time | Call hold duration / Abandoned. |
| Total Talk Time | Total duration for which the agent was on the call. |
| Total Hold Time | Total duration for which the agent was on hold. |
| Total Wrapup Time | Total duration for which the agent was in the wrap-up state. |
| Total Handle Time | Total Talk Time + Total Hold Time + Total Wrap Time. |
| Average Talk Time | Total Talk Time / Handled. |
| Average Hold Time | Average time that your customers are placed on hold by agents during calls. |
| Average Wrapup Time | Total Wrap Time / Handled. |
| Average Handle Time | Total Handle Time / Handled. |
- The sum of the values in each column except the Date column appears in the last row of the table.
- You can export the report to an Excel, CSV, or PDF file by using the Export button.
- You can print the report by using the Print button.