Download PDF
Download page Agent Summary Report.
Agent Summary Report
This report provides summarized agent-level metrics for the selected periods. Unlike the Agent Activity Report that provides a day-by-daybreak out, the Agent Summary Report can provide aggregate information of multiple days. This report is valuable for quickly viewing an agent's overall metrics or comparing those metrics with the average or other agents.
Search Criteria
To access the Agent Summary Report, navigate to Review > Agent Reports > Agent Summary Report. This takes you to the Agent Summary Reporting search tool to choose the parameters for the report.
You can generate a report for a 31-day period occurring during the previous 180 days. LiveVox can provide reports for additional time periods, if requested.
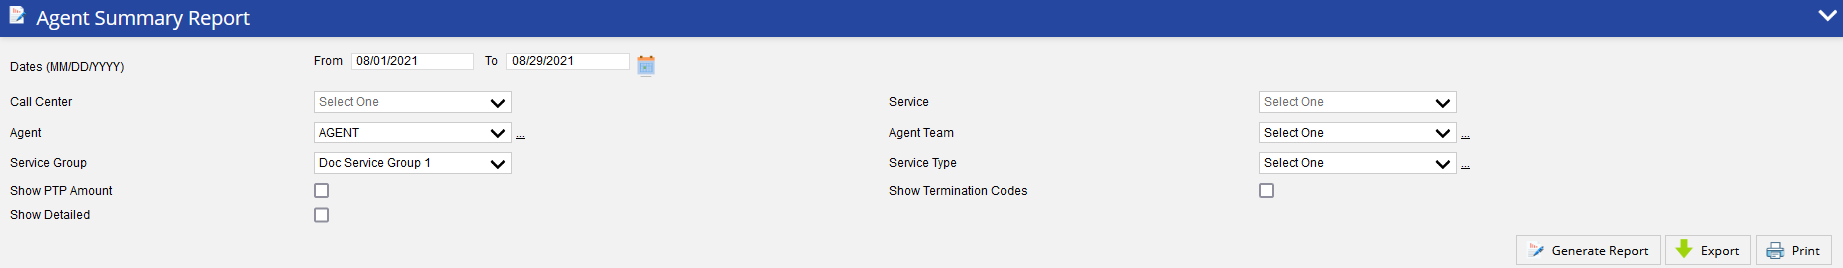
Specify the following options to generate the report. Only a date range is required to generate the report and the rest of the fields are optional. You can use these optional fields to get specific records.
- Date Range: Enables you to type in dates in the format of MM/DD/YYYY or choose dates using the calendar button. Click on the calendar button to open the Date Picker screen.
- Under the Range tab, you can select the date range.
Under the MultiSelect tab, you can select multiple sequential or non-sequential dates.
- Call Center: Select a call center from the drop-down menu.
- Multiple Call Center Selection: Click the link next to the Call Center drop-down menu to open the Select Call Center window.
- Search the required call center by typing the text in the Search textbox.
- Click a call center from the Available column to move it to the Assigned column.
- Click the Assign All button to add all the available call centers to the Assigned column.
- Click a call center from the Assigned column to remove the assigned call center. It will be moved to the Available column.
- Click the Remove All button to remove all the assigned call centers. They will be moved to the Available column.
- Multiple Call Center Selection: Click the link next to the Call Center drop-down menu to open the Select Call Center window.
- Services: You can select a particular service from the Services drop-down menu. If you select a particular call center before selecting a service, services available for that particular call center will appear.
- Multiple Service Selection: Clicking on the link next to the Service drop-down menu will open the Service Selection window:
- Search the required Service by typing the text in the Search textbox.
- Click a service from the Available column to move it to the Assigned column.
- Click the Assign All button to add all available services to the Assigned column.
- Click a service from the Assigned column to remove it from the assigned services. It will be moved to the Available column.
Click the Remove All button to remove all the assigned services. They will be moved to the Available column.
- Multiple Service Selection: Clicking on the link next to the Service drop-down menu will open the Service Selection window:
- Agent: Select the specific agent for whom you want to view the report.
- Multiple Agent Selection: Click on the link next to the Agent drop-down menu to open the Select Agent window.
- Search the required agent by typing the text in the Search textbox.
- Click an agent from the Available column to move it to the Assigned column.
- Click the Assign All button to add all the available agents to the Assigned column.
- Click an agent from the Assigned column to remove the assigned call center. It will be moved to the Available column.
- Click the Remove All button to remove all the assigned agents. They will be moved to the Available column.
- Multiple Agent Selection: Click on the link next to the Agent drop-down menu to open the Select Agent window.
- Agent Team: Select the specific agent team to view the report for that team.
- Service Group (SG): Service Group is the system that defines which outbound services agents should be logged into to receive the calls from inbound services as well as outbound blending. Further details are available from the Service Grouping section. Adding the ability to group the reports’ metrics based on the Service Group allows better visibility into the agents’ efficiency across all services (including inbound) they may have been working.
- Service Type: Allows you to select a particular service type using the Service Type drop-down menu. If a particular service type is selected, only the services available for that service type appear in the Services drop-down list.
- Multiple Service Selection: Click on the link next to the Service Type drop-down menu opens the Select Service Type window:
- Search the required service type by typing the text in the Search textbox.
- Click a service type from the Available column to move it to the Assigned column.
- Click the Assign All button to add all available service types to the Assigned column.
- Click a service type from the Assigned column to remove it from the assigned service types. It will be moved to the Available column.
- Click the Remove All button to remove all the assigned service types. They will be moved to the Available column.
- Multiple Service Selection: Click on the link next to the Service Type drop-down menu opens the Select Service Type window:
- Show Termination Codes: If the selected campaign was run on an agent desktop service with disposition codes, all the codes will be displayed within the report.
- Show PTP Amount: Displays the cumulative PTP amount entered by each agent for the selected period and search criteria.
- Show Detailed: You can select this field to generate a report with detailed information.
Generate Report and Results
Report columns and sequences can be easily modified to provide you with a report view that is important to your business operation.
Column Customization
To customize columns:
- Click the cog icon in the upper right of the Results panel. You are presented with the Customize Column window.
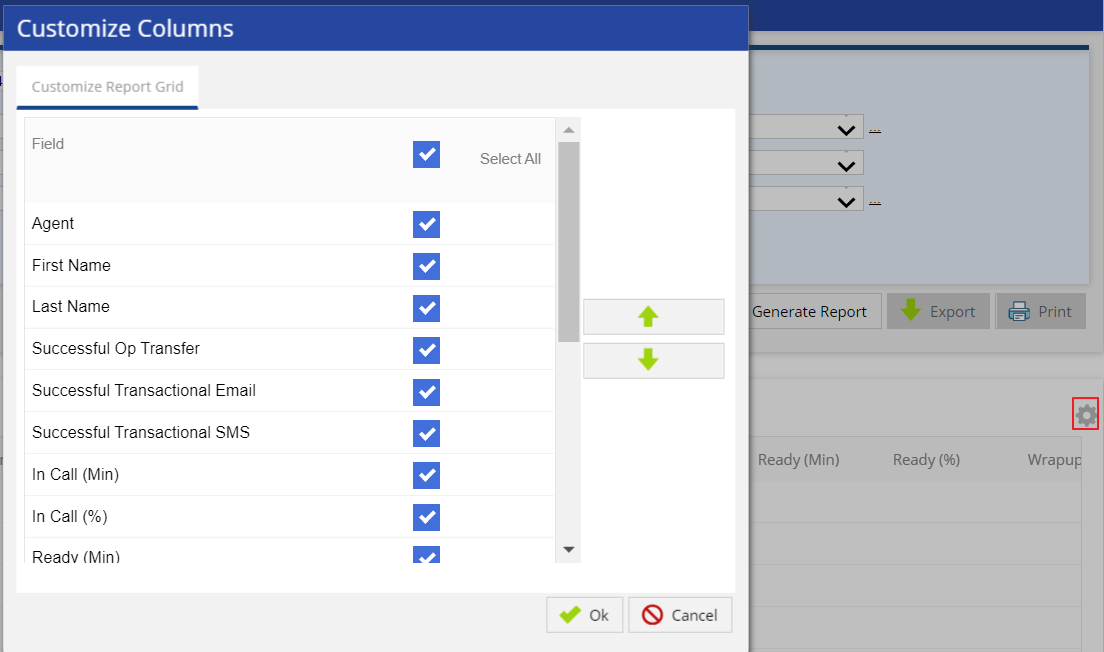
- Place a checkmark to the right of the field you want to be displayed and unchecked for those to be hidden. See below the Generate Report section for more information on available fields in the report.
- Re-sequence the displayed fields by selecting a column and moving it up or down using the appropriate button.
- Choose which field to use for ordering the displayed information from the Sort Order drop-down.
- If you prefer ascending order, select the Ascending checkbox.
- Click OK to update the view.
Generate Report
After choosing the search parameters, generate the report by clicking the Generate Report button to the right of the search options. The report generates the following data when the maximum number of options (Show PTP Amount, Show Detailed, and Show Termination Codes) are selected.
You cannot generate reports for more than 3 days if the Show PTP Amount or Show Termination Codes option is selected.
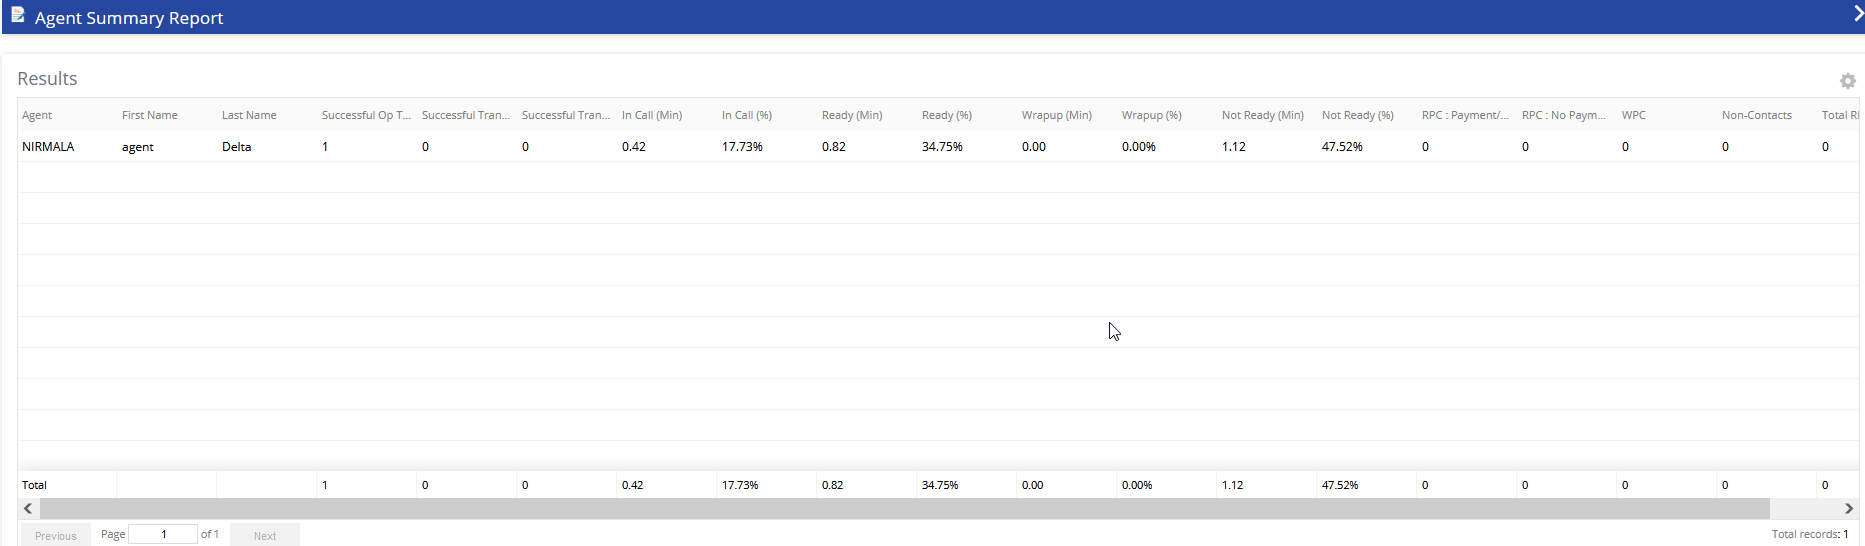
The following optional fields are available as report columns:
- Agent: Login ID of an agent.
- First Name: First name of the agent.
- Last Name: Last name of the agent.
- Successful Op Transfer: Total number of operator transfers that successfully connected to the agent.
- Successful OB Transfer: Total number of outbound transfers that successfully connected to the agent (This is calculated as Successful Operator Transfer - Successful Manual Transfer - Successful IB Transfer).
- Successful Manual Transfer: Total number of manual transfers that successfully connected to the agent.
- Successful IB Transfer: Total number of inbound transfers that successfully connected to the agent.
- Successful Transactional Email: Total number of Email transactions by the agent.
- Successful Transactional SMS: Total number of SMS transactions by the agent.
- In Call (Min): Total time in minutes the agent was In Call state.
- In Call %: Total amount of time the agent spent In Call state divided by the Agent System Time.
- Ready (Min): Total time in minutes the agent was in Ready state.
- Ready %: Total amount of time the agent spent in Ready state divided by the Agent System Time.
- Wrapup (Min): Total time in minutes the agent was in Wrap Up state.
- Wrapup %: Total amount of time the agent spent in Wrap Up state divided by the Agent System Time.
- Not Ready (Min): Total time in minutes the agent was in Not Ready state. It is the addition of break code columns. Break codes provide the reasons for not being ready and they are Lunch, Training, Break Time, Meeting, Technical Difficulty, and Others.
- Not Ready %: Total amount of time the agent spent in Not Ready state divided by the Agent System Time.
- Lunch (Min): Total time in minutes the agent spent on Lunch break code.
- Lunch %: Total amount of time the agent spent on Lunch break code divided by the Agent System Time.
- Training (Min): Total time in minutes the agent spent on Training break code.
- Training %: Total amount of time the agent spent on Training break code divided by the Agent System Time.
- Break Time (Min): Total time in minutes the agent spent on Break Time break code.
- Break Time %: Total amount of time the agent spent on Break Time break code divided by the Agent System Time.
- Meeting (Min): Total time in minutes the agent spent on Meeting break code.
- Meeting %: Total amount of time the agent spent on Meeting break code divided by the Agent System Time.
- Technical Difficulty (Min): Total time in minutes the agent spent on Technical Difficulty break code.
- Technical Difficulty %: Total amount of time the agent spent on Technical Difficulty break code divided by the Agent System Time.
- Other (Min): Total time in minutes the agent spent on Other break code.
- Other %: Total amount of time the agent spent on Other break code divided by the Agent System Time.
- Agent System Time (Min): Total time the agent was logged into LiveVox which includes Ready, In Call, Wrap Up, and Not Ready Time.
- Agent Productive Time (Min): Total time in minutes the agent spent in an In Call, Wrap Up, or Ready state.
- Avg Call Handled / Agent Talk Hr: Total Calls divided by In Call time in hours (In Call minutes divided by 60).
- Avg Call Handled / Agent System Hr: Total Calls divided by Agent System Time in hours (Agent System Time Minutes divided by 60).
- Avg Call Length (Min): Total In Call minutes divided by Total Calls.
- RPC: Payment/ PTP: Total calls with a result code of RPC with Payment Arranged.
- RPC: No Payment/ PTP: Total calls with a result code of RPC with No Payment Arranged.
- WPC: Total of calls coded as a Wrong Party Connect.
- Non-Contacts: Total calls coded as other (not RPC or WPC).
- PTP Amount: Total amount of PTP payment. This data can be searched across a maximum of three days if Show PTP is selected.
- Total RPCs: Total of both RPC with Payment Arranged and RPC with No Payment Arranged result codes.
- Total RPCs / Agent System Hr: Total RPCs divided by Total Agent Productive Time in hours.
- RPC Rate (%): Total RPCs divided Successful Operator Transfer.
- Conversion Rate (%): Total calls coded as a PTP divided by Total RPCs.
- Termination Codes: Total calls with specific termination code selected.
Additional Buttons
- To export the generated report, click the Export button (next to the Generate Report button) and select the required option of file type. The available options are PDF, Excel, CSV.
- To print the generated report, click the Print button (next to the Export button). The generated report opens in another tab. Select the details for printing the report and click the Print button.