The Account Penetration Summary Report displays an executive summary of attempts per account along with efficiency ratios that display average attempts per account per outcome type. It has the ability to be searched at the enterprise level, call center, or service.
Interpretation of the data is easiest moving from left to right, starting in the Break Down Of All Accounts section. Keep in mind that the information shown is specific to the services/call centers and time period selected for the report. The data in each column represents:
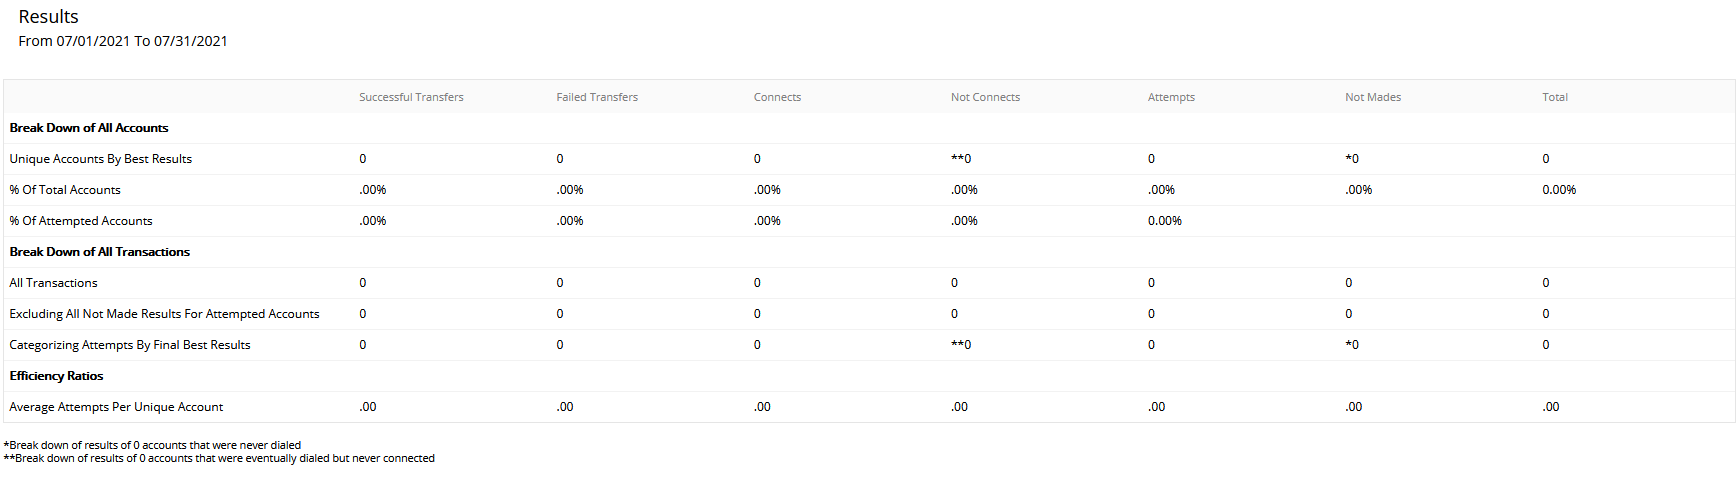
Successful Transfers - The attempts to bridge connected calls to agents that were successful (vs Failed Transfers) Failed Transfers - The attempts to bridge connected calls to agents that were unsuccessful (vs Successful Transfers) Connects - The total number of dials resulting in a connect with a live party or automated response (answering machine, fax, etc) Not Connects - The total number of dials not able to connect (breakdown is visible from the ** section towards the bottom of the report) Attempts - The total number of dials (Connects + Not Connects) Not Mades - The total number of accounts or transactions which were not attempted/dialed (breakdown of the reasons why is available from the * section at the bottom of the report) Total - The total number of accounts or transactions loaded to the system (Attempts + Not Mades)
The "Average Attempts Per Unique Account" under the Efficiency Ratios section informs on the average number of attempts on each account. This is calculated by dividing each column's "Categorizing Attempts by Final Best Results" by "Unique Attempts by Best Results."