The Tickets Real-Time Dashboard displays real-time information about all open tickets in the form of bar charts and pie charts. The widgets in the dashboard are automatically updated when a new ticket is opened or when there is an update in the currently open tickets.
The dashboard displays information about open tickets only .
You cannot add or modify ticketing data in the dashboard.
Accessing the Tickets Real-Time Dashboard
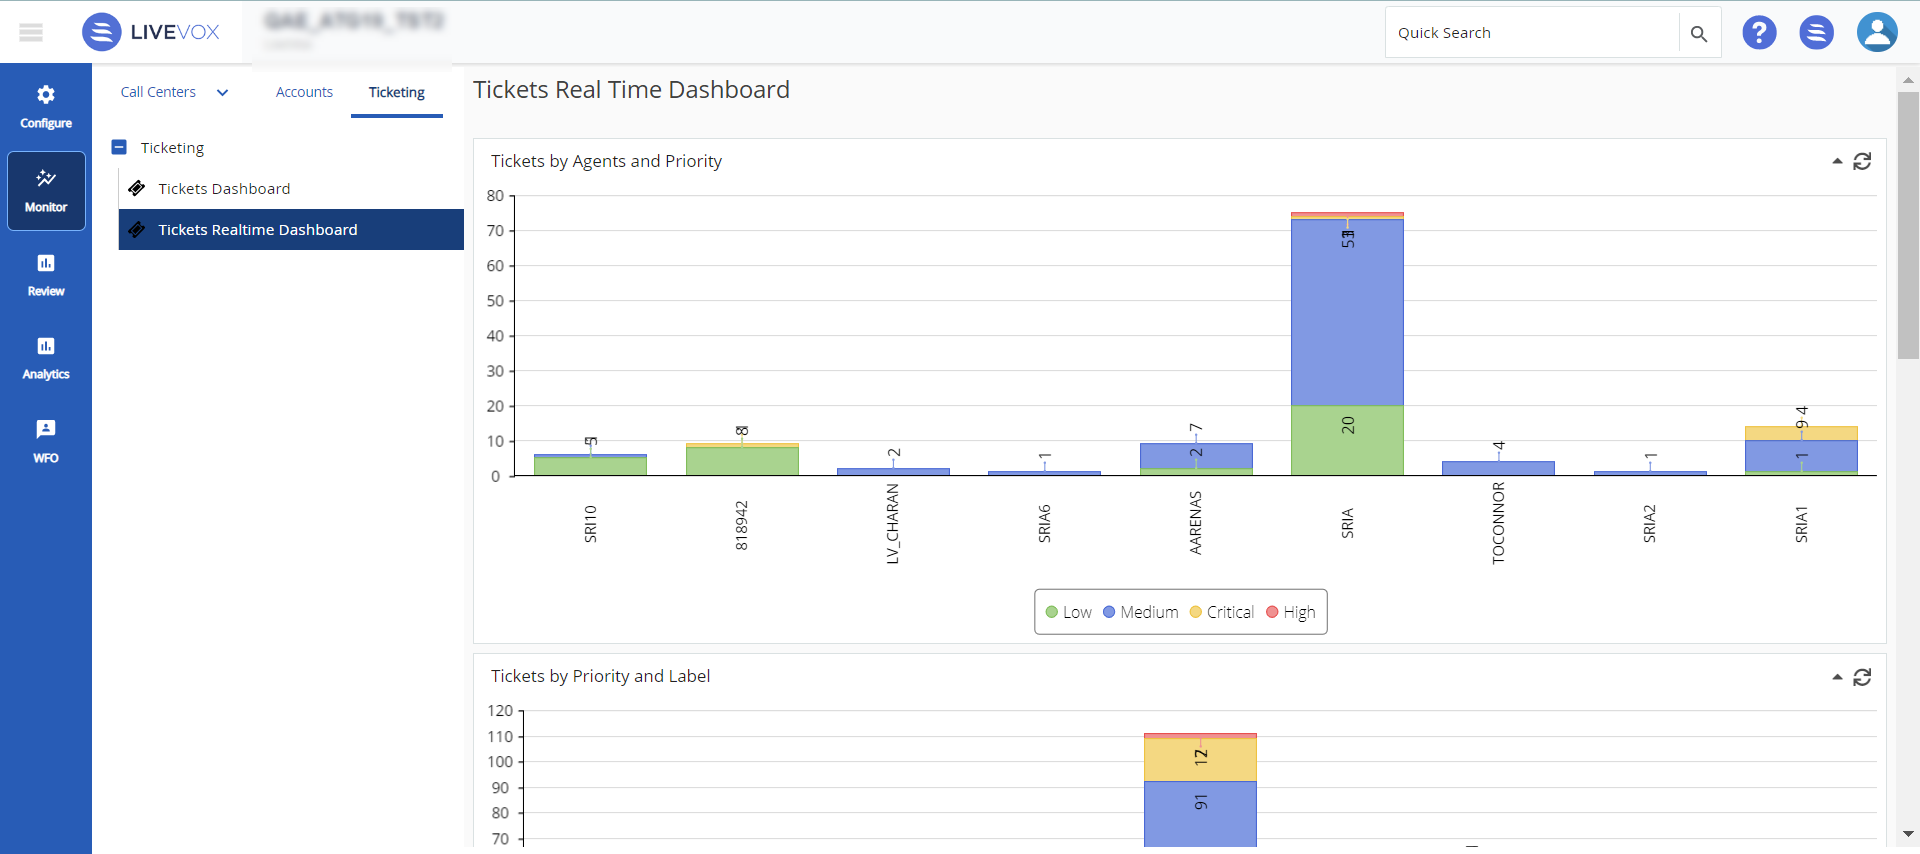
To access the Tickets Real-Time Dashboard, on theMonitortab, on theTicketingsubtab, go toTicketing >Tickets Realtime Dashboard.
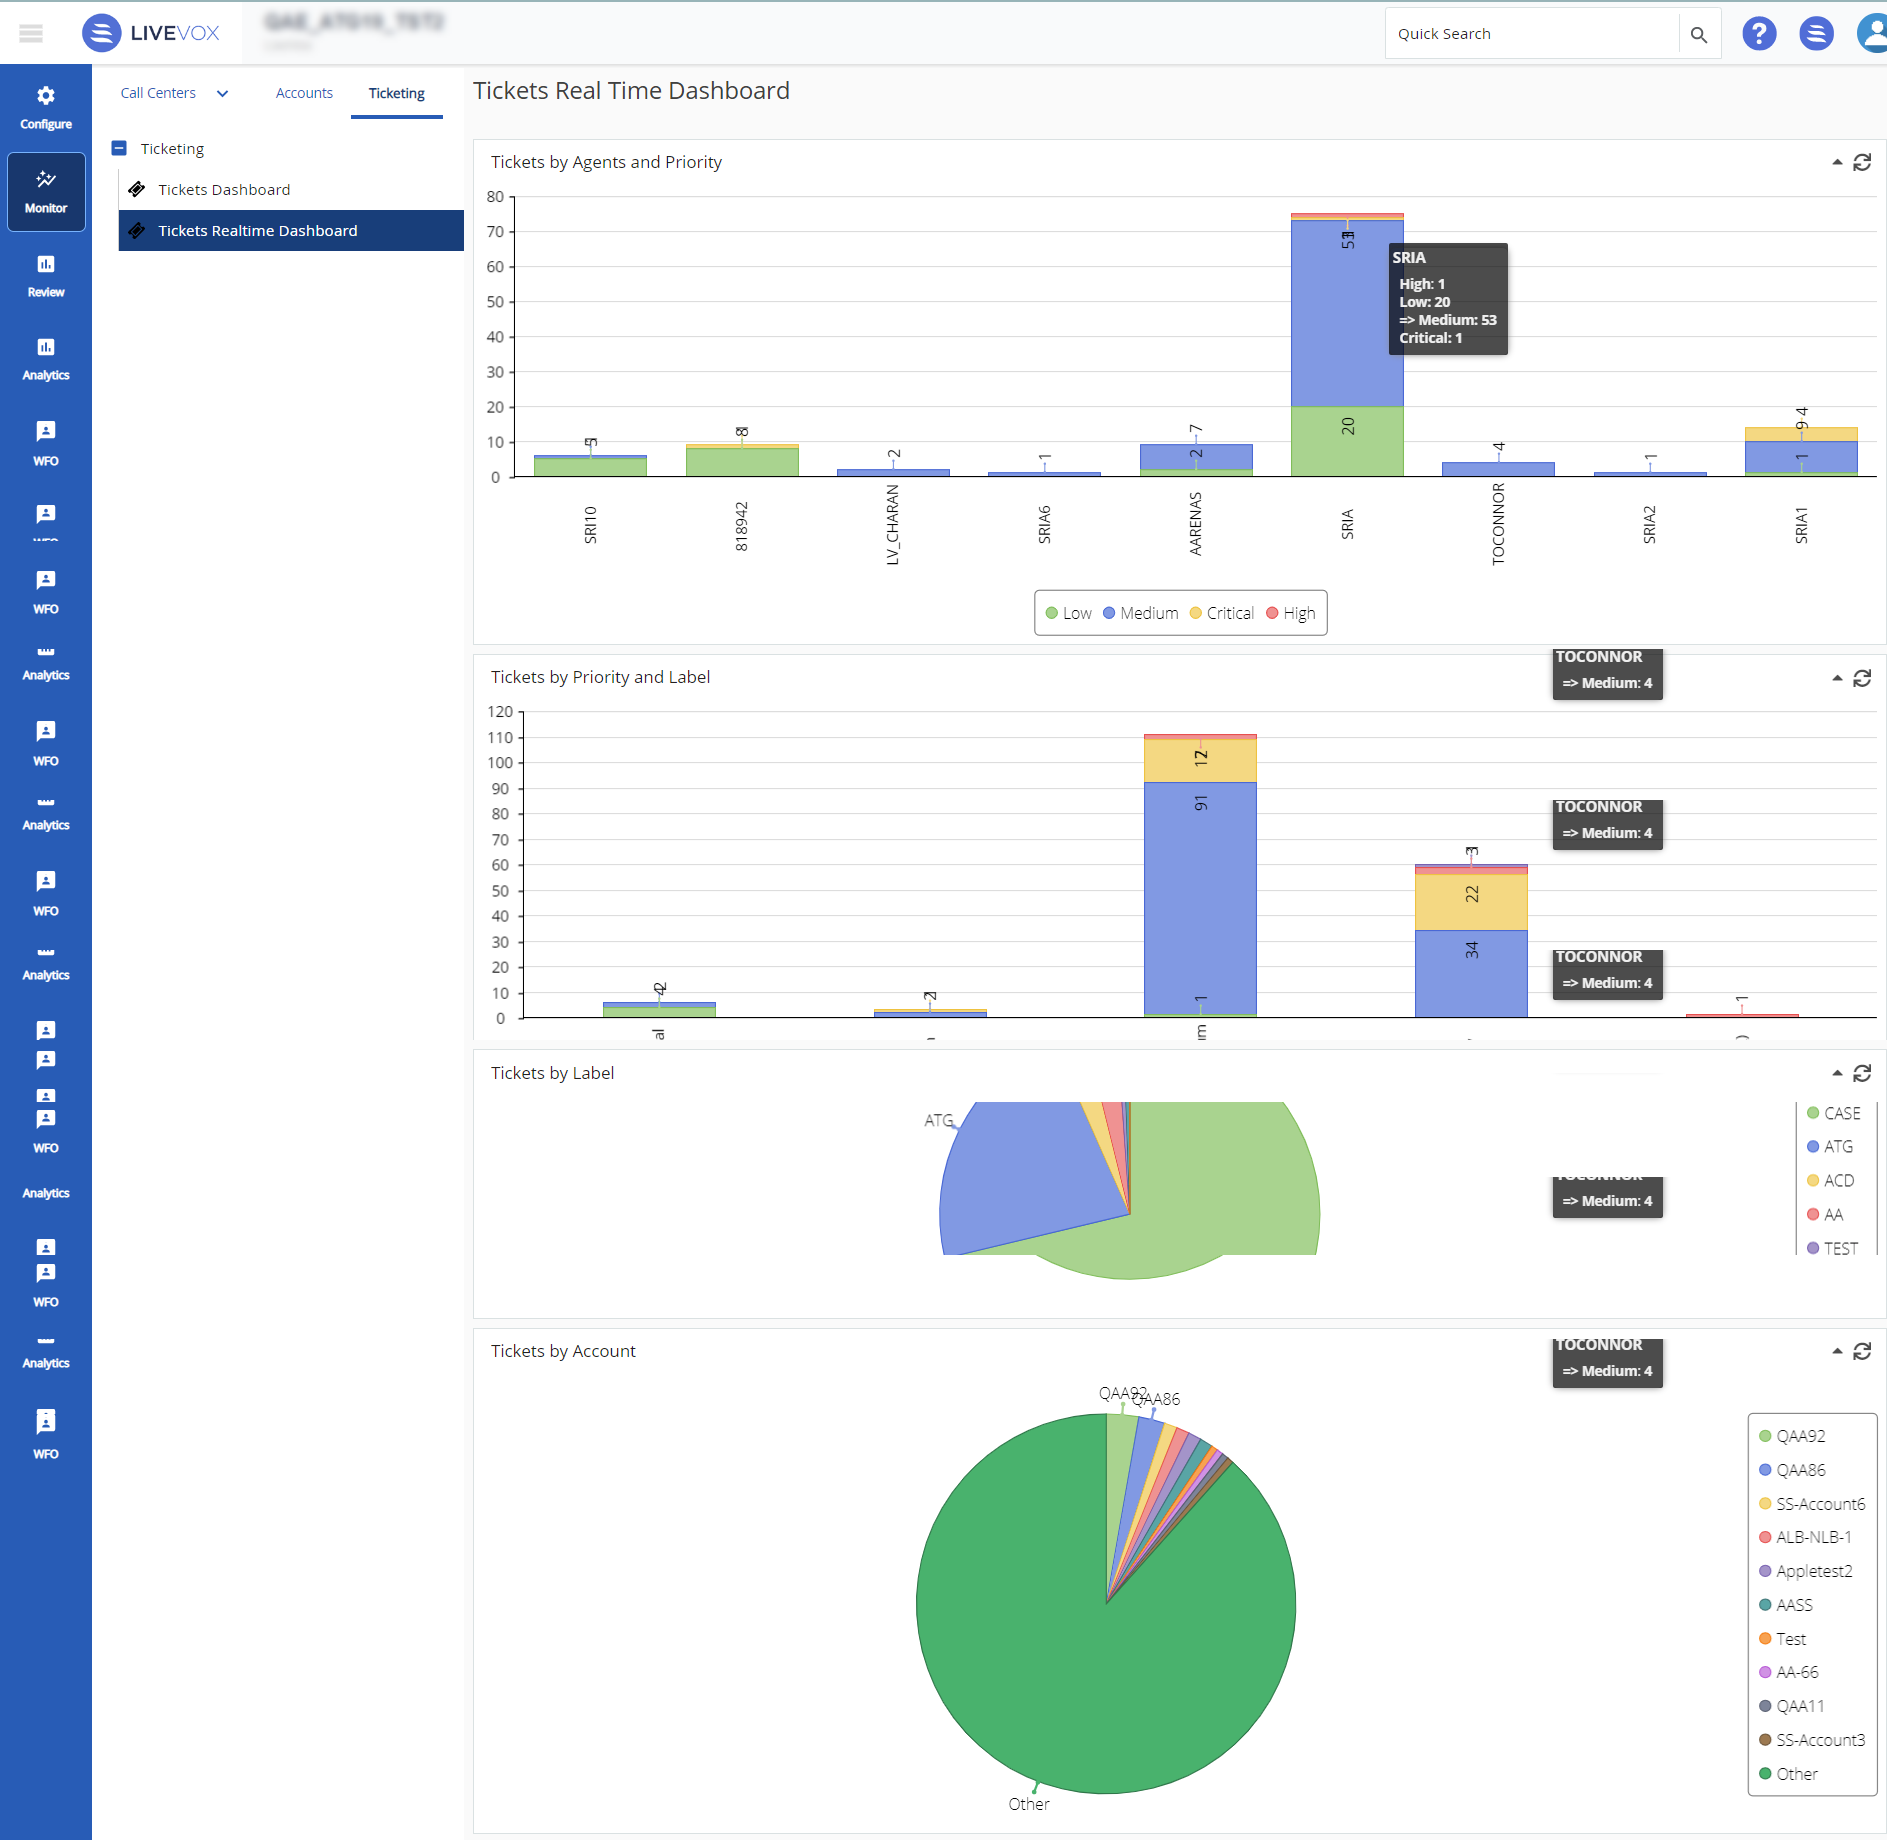
TheTickets Real Time Dashboard window appears, displaying the following statistics:
Tickets by Agents and Priority:Number of open tickets assigned to each agent and their priority levels.
Tickets by Priority and Label: Number of open tickets categorized based on priority and label.
Tickets by Label: Number of open tickets categorized based on the label.
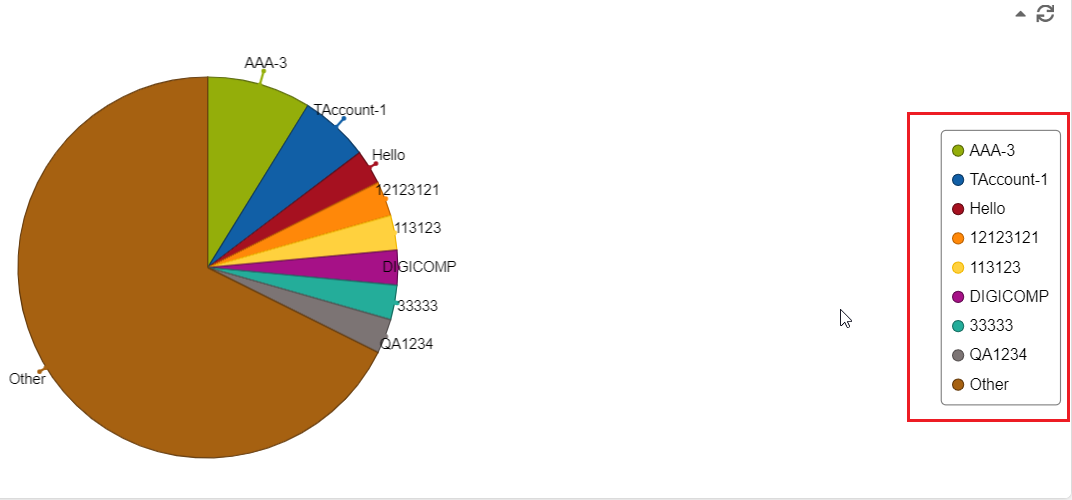
Tickets by Account: Number of open tickets pertaining to each account.
You can manually refresh the charts by clicking on the refresh icon () in the top-right corner of every widget.
To collapse or expand the widget panels, click on the arrow icon, next to the refresh icon, on the top right corner of every widget.
Hover over the data representations on the chart to view the values, percentage, total number of open tickets, and so on.
Filtering Data
To customize the data selection in the charts, use the buttons available in each widget. You can identify the button representing either agent name, priority, label, or account name by matching the color of the button and corresponding slice in the chart. When youdeselect a button, the slice representing the selected item disappears from the chart.