LiveVox Unified Analytics dashboards display insights from individual key performance indicators (KPIs). You can use the dashboards to perform activities, such as tracking changes to your key performance indicators (KPIs), setting email alerts, and viewing changes to KPIs in graphical form and so on. You can use KPIs to evaluate whether you have met your performance objectives. For example, you can use KPIs to track the total number of inbound calls and the average speed of answering those calls.
To create a dashboard:
Create or add an insight. An insight represents ananalytical view of your data such as total number of inbound calls per hour. You cancreate insights before creating a dashboard, seeCreating an Insightor add an existing insight while you are creating a dashboard, see Adding an Insight.
Add KPIs to the insight.
Add filters to view KPIs for a specific period.
Adding an Insight
Adding insights allows you to addmeasures and attributes (such as average handle time and contact account number) to support the insight.
To create an insight:
Go to theAnalyticstab and clickAdd Dashboards. An untitled dashboard appears.
In theUntitledfield, enter a name for the dashboard.
From theDrag to addpane, drag the insight and drop it in the right pane.
Add the insight using one of the following methods:
Drag and drop a new insight from theNew Itemsection in the left pane. An untitled insight page appears.
Drag and drop insights according to the measures you want to view on the dashboard and clickSave.
Drag and drop anexisting insightfrom the Saved Insightssection in the left pane. An untitled insight page appears.
ClickEdit.
Drag and drop an existing insight from the Saved Insightssection in the left pane. An untitled insight page appears.
In theUntitled insightwindow, drag and drop the measures and attributes you want to see on the insight.
ClickSave. The dashboard main page is displayed and you can add KPIs to the dashboard.
Adding KPIs
You can add KPIs to your dashboard.
Before you begin
Ensure that you have added the insight.
To add KPIs:
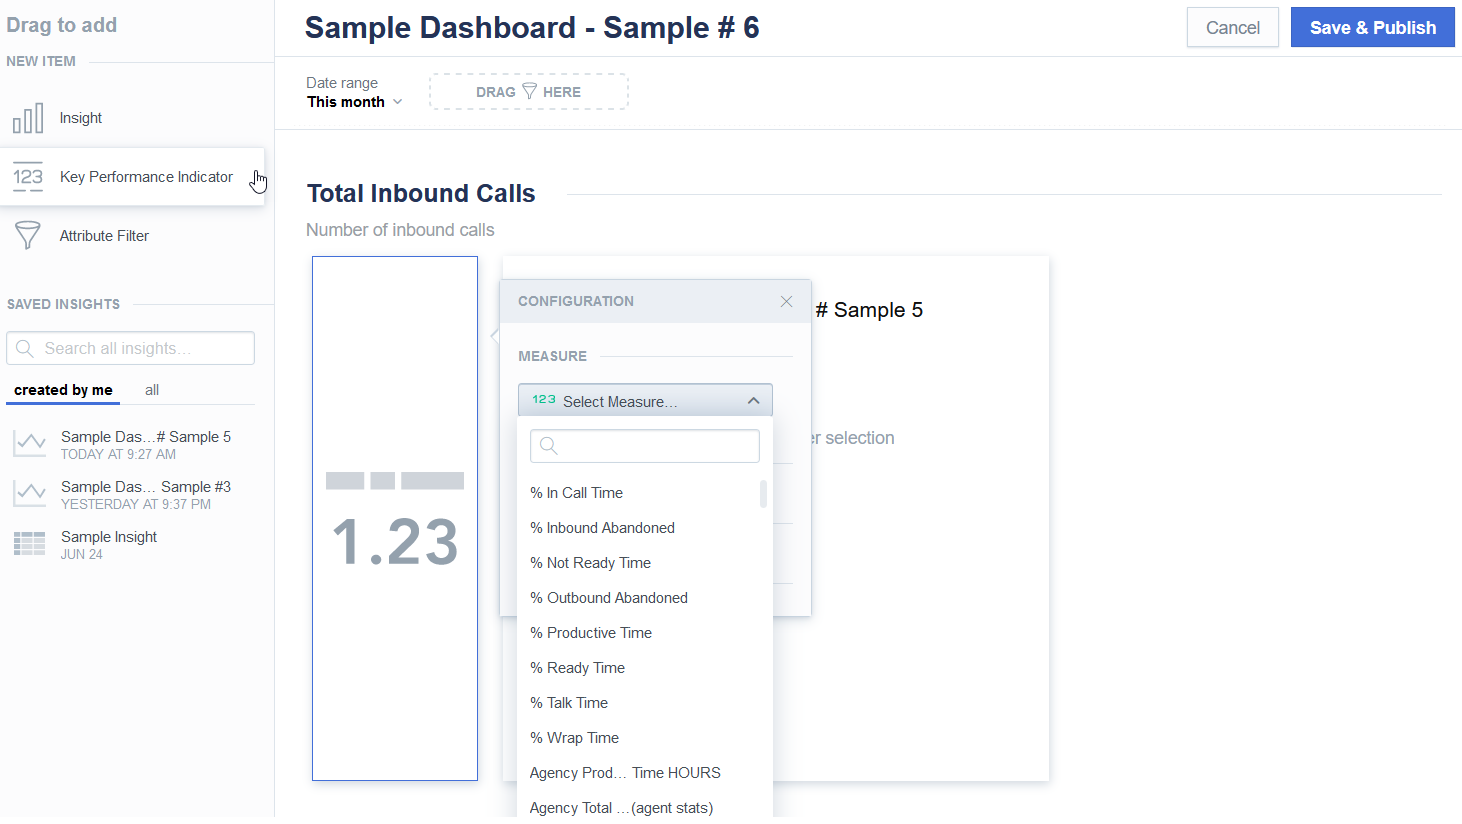
On the dashboard main page, drag and drop the KPI indicator icon:
On theConfigurationdialog box, select a KPI, for example, Total Inbound Calls.
Enter a name and description for the KPI.
To add more than one KPI, repeat the procedure.
ClickSave & Publish.
Adding Filters
You can add filters to view KPIs for a specific period.
Before you begin
Ensure that you have added an insight and KPIs.
To add filters:
ClickEditon the dashboard.
Drag and drop the attribute filters by which you want to filter the data on the dashboard. For example, filter the data by date range.
After adding the required insights, KPIs, and attributes, clickSave & Publish.