Download PDF
Download page Monitor Dashboard.
Monitor Dashboard
The first tab of the Monitor section provides detailed metrics for different communication channels, such as Voice, Email, SMS, and Chat. These metrics vary depending on the hierarchy of the contact center you select.
To efficiently manage all the contact centers within an organization, a broad hierarchical structure is defined as follows:
- Call Center: The second level of the hierarchy, dividing your LiveVox portal into geographic locations, lines of business, or other appropriate groupings. This separation helps track the performance of different business areas.
- Service Groups: Service Groups are created to blend traffic from different services. Each Service Group contains multiple Services.
On the Monitor tab, in the left pane, select the hierarchical level for which you want to view information. Choose from Enterprise, Call Center, Service, and Service Group. The right pane displays information for different communication channels based on the levels selected.
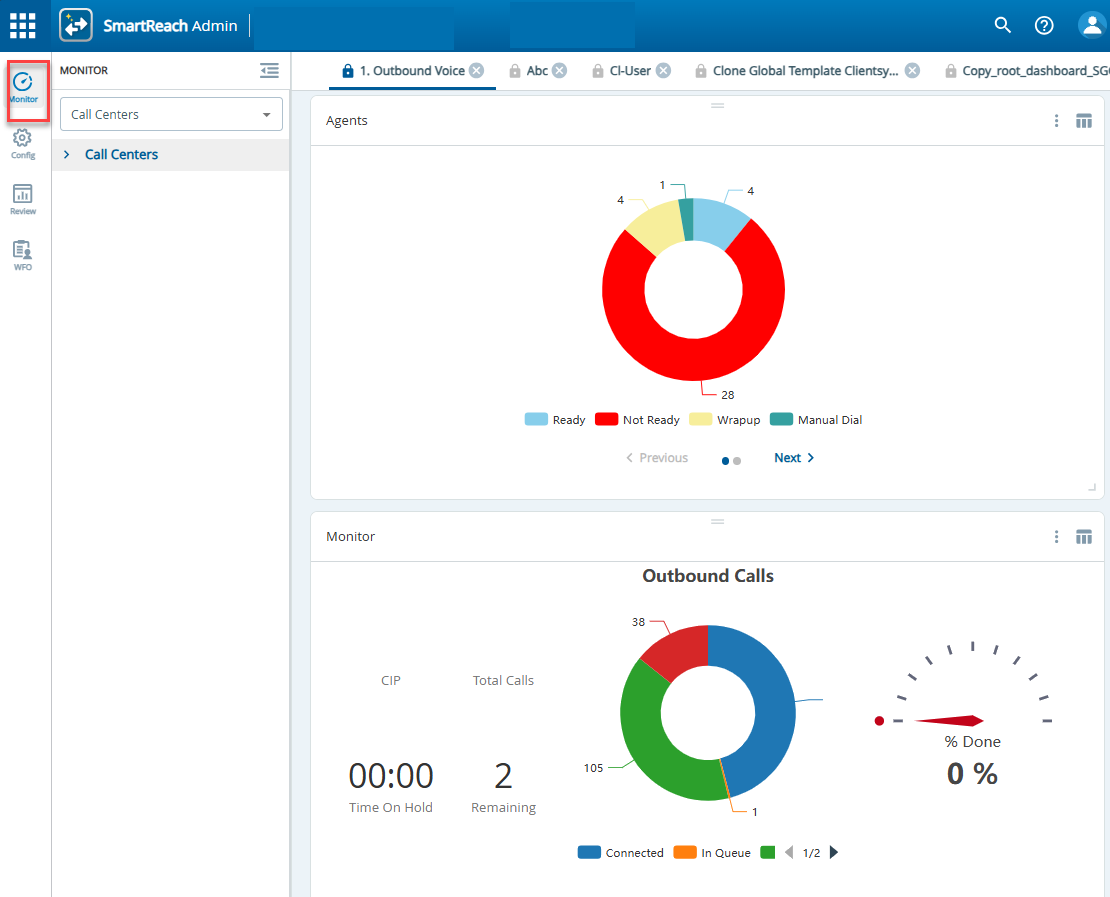

Dashboard widgets can temporarily fail to display correctly after an update to the monitoring dashboard user interface. For example, the widgets may not be aligned properly, or some widgets may not appear correctly. This behavior might be due to a stale browser cache. You can clear the browser cache or site data to restore normal behavior. Follow browser-specific instructions to clear the cache.
Optimized Outbound Dashboards
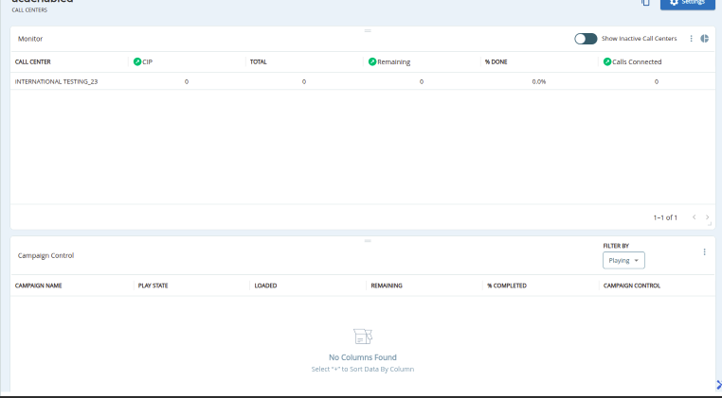
Outbound Engagement dashboards feature an optimized layout that hides inactive ACD and inbound data fields when integrated with the CXone platform. This ensures that monitoring views remain focused on relevant campaign metrics, such as calls connected and digital engagement rates, across Enterprise, Call Center, and Service dashboard levels. The system hides widgets and data columns related to inbound, chat, and specific ACD statistics that do not produce data in the integrated environment, ensuring your dashboards remain focused on essential outbound campaign metrics.
The following metrics are displayed under the optimized dashboards at the Enterprise, Call Center and Service levels:
Call Metrics
CIP, Remaining, Calls Connected, Calls Failed
Email Metrics
Email Bounced Rate, Email Click Rate, Email Delivered Rate, Email Open Rate, Email Suppressed Rate, Email Unsubscribe Rate
SMS Metrics
SMS Delivered, SMS Failed, SMS Suppressed
- The Active Widgets will only show widgets that are still visible after enabling the CXOne ACD feature.
- The Metrics widget displays only the Outbound metrics.
Selecting Hierarchy Levels of Monitor Dashboard
You can select different hierarchies such as Call Center, and Service Group.
To select a hierarchy level:
- Navigate to the Monitor tab.
- Using the drop-down, select the hierarchy level. Choose between Call Centers and Service Groups.
This section contains the following topics: