The Adherence window provides details about how effectively you followed a designated schedule. The following two key indicators are used to calculate your adherence percentage:
- time scheduled activities, such as answering calls, responding to emails, and other tasks are expected to be carried out.
- time spent carrying out designated tasks.
A higher percentage indicates better adherence to the schedule and proper utilization of the designated time.
Accessing Adherence Tab
To access the Adherence tab, on the Agent Desktop and click Adherence.
The Adherence screen displays the scheduling adherence and conformance data for a single day and multiple days in different tabs. Single-day data is further divided into hourly information.
Click  to search using specific filter criteria. You can specify the Date Range, Time Range, Areas, and Schedules to display the required information.
Multi-Day Tab
By default, the Multi-Day tab is displayed when you click Adherence.
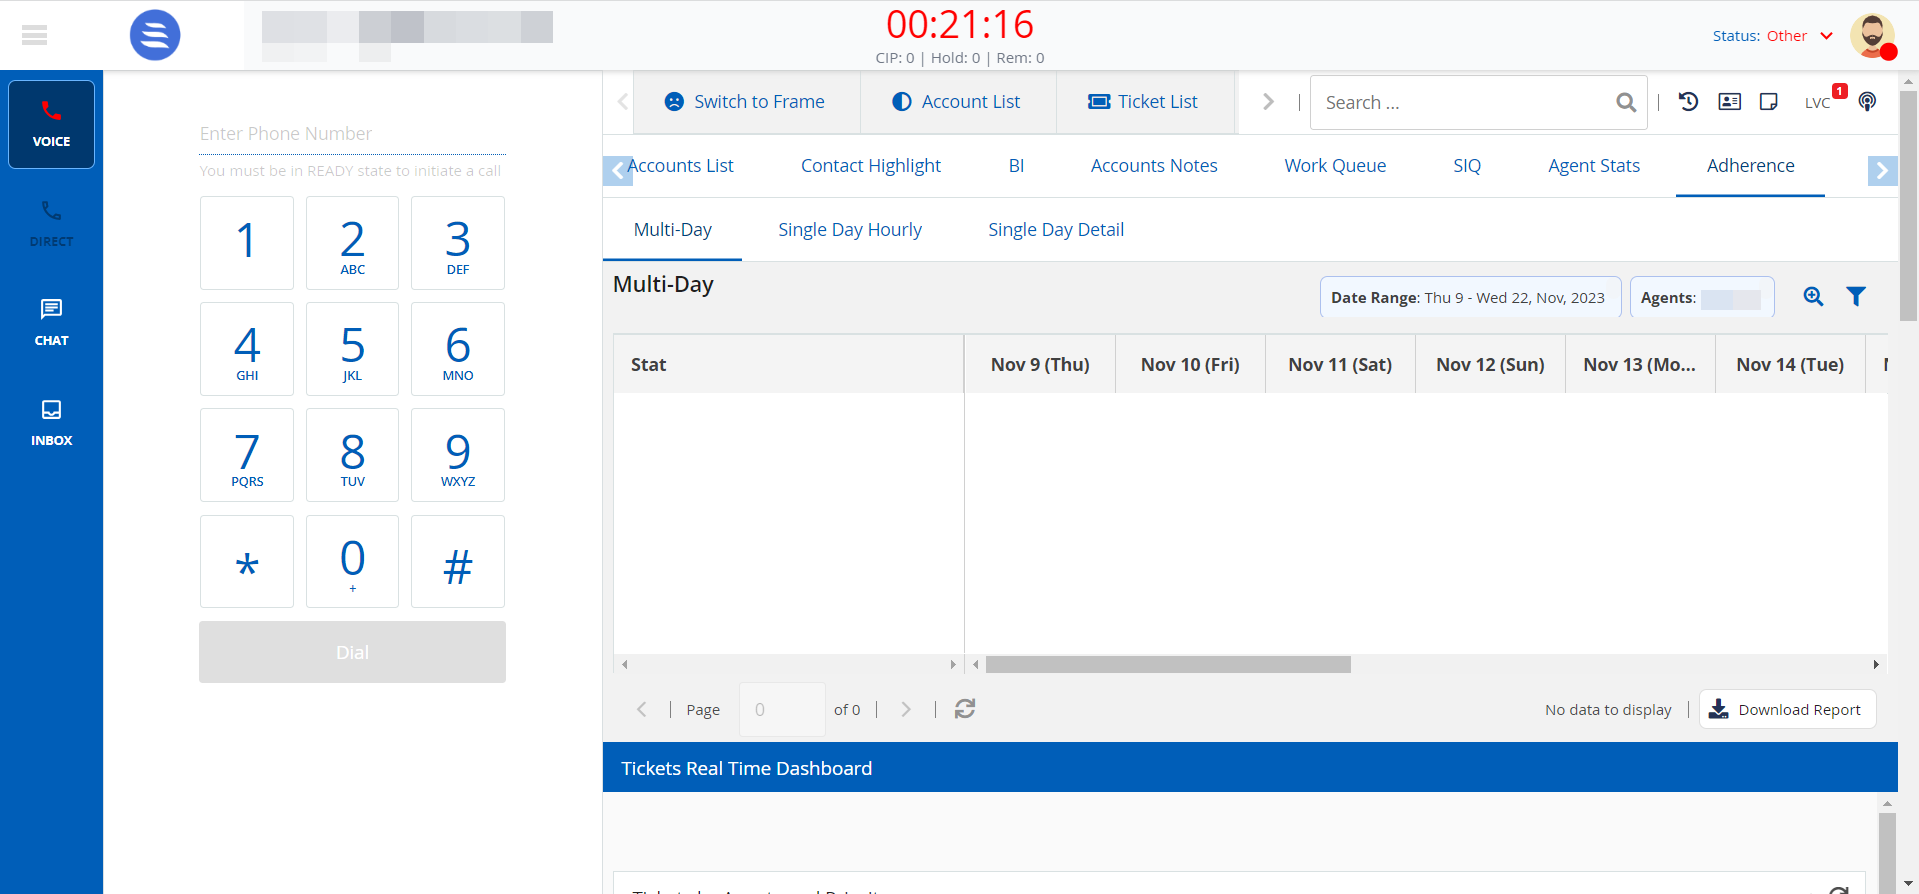
The following information for the days specified in the filter criteria is displayed:
- Click
 to view more statistics and click
  to view fewer statistics.
 - Click Download Report to download the report .
Single Day Hourly Tab
The Single Day Hourly tab provides a graphical representation of the detailed statistics for the selected date and time range.
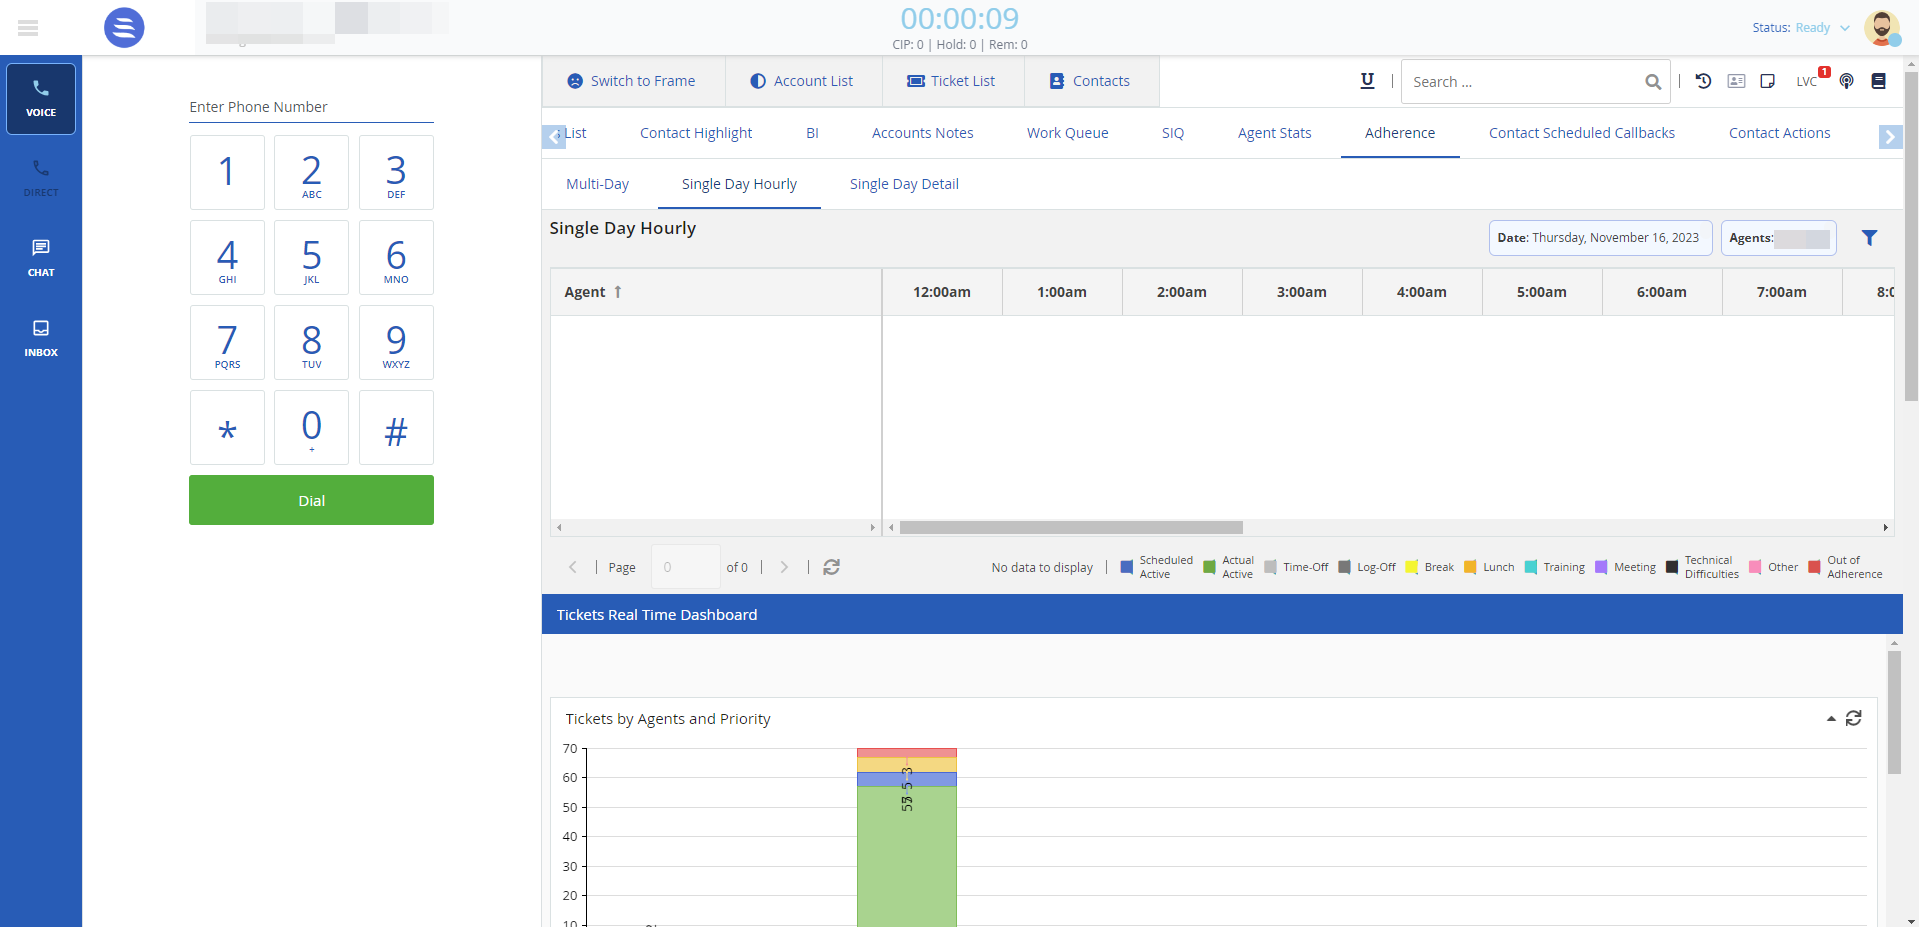
The following statistics are displayed in different colors:
- Scheduled Active
- Actual Active
- Time-Off
- Log-Off
- Break
- Lunch
- Training
- Meeting
- Technical Difficulties
- Other
- Out of Adherence
Single Day Detail Tab
The Single Day Detail tab displays the scheduled and actual activity times for a specified day. The screen displays Scheduled time/duration, Actual time/duration, Scheduled Activity, Actual Activity, and Description.
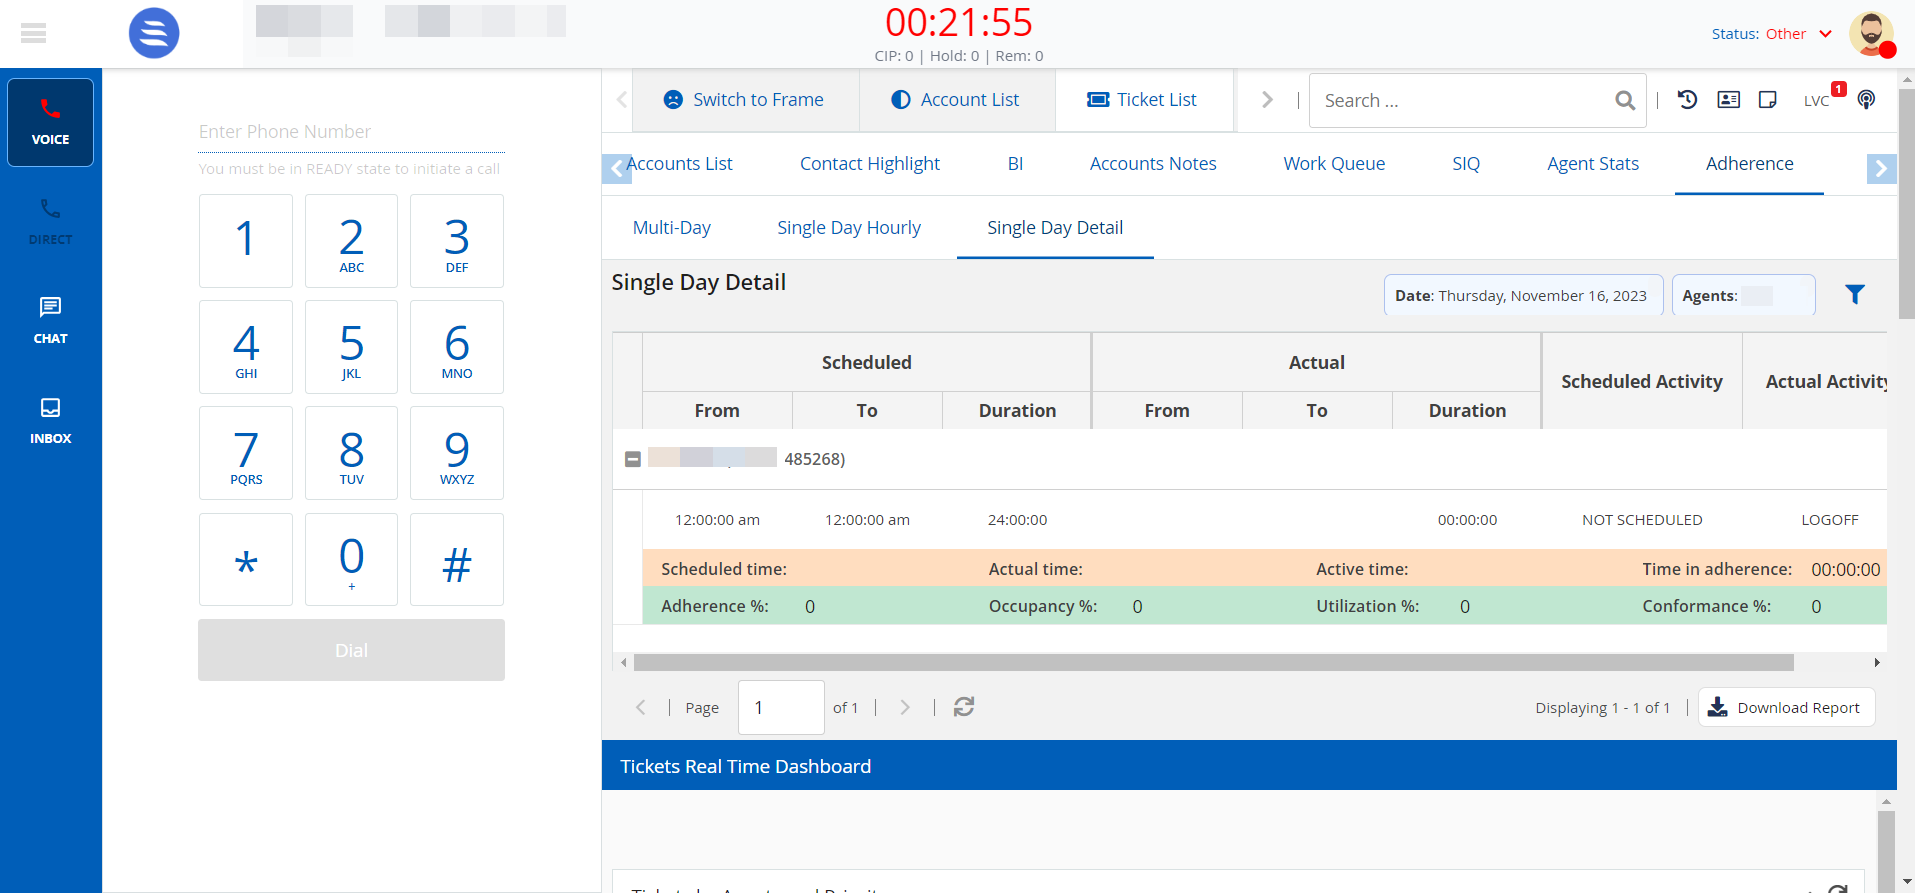
Information, such as Scheduled time, Actual time, Active time, Time in adherence, Adherence %, Occupancy %, Utilization %, and Conformance % are also displayed.