Interaction Intent Dashboard
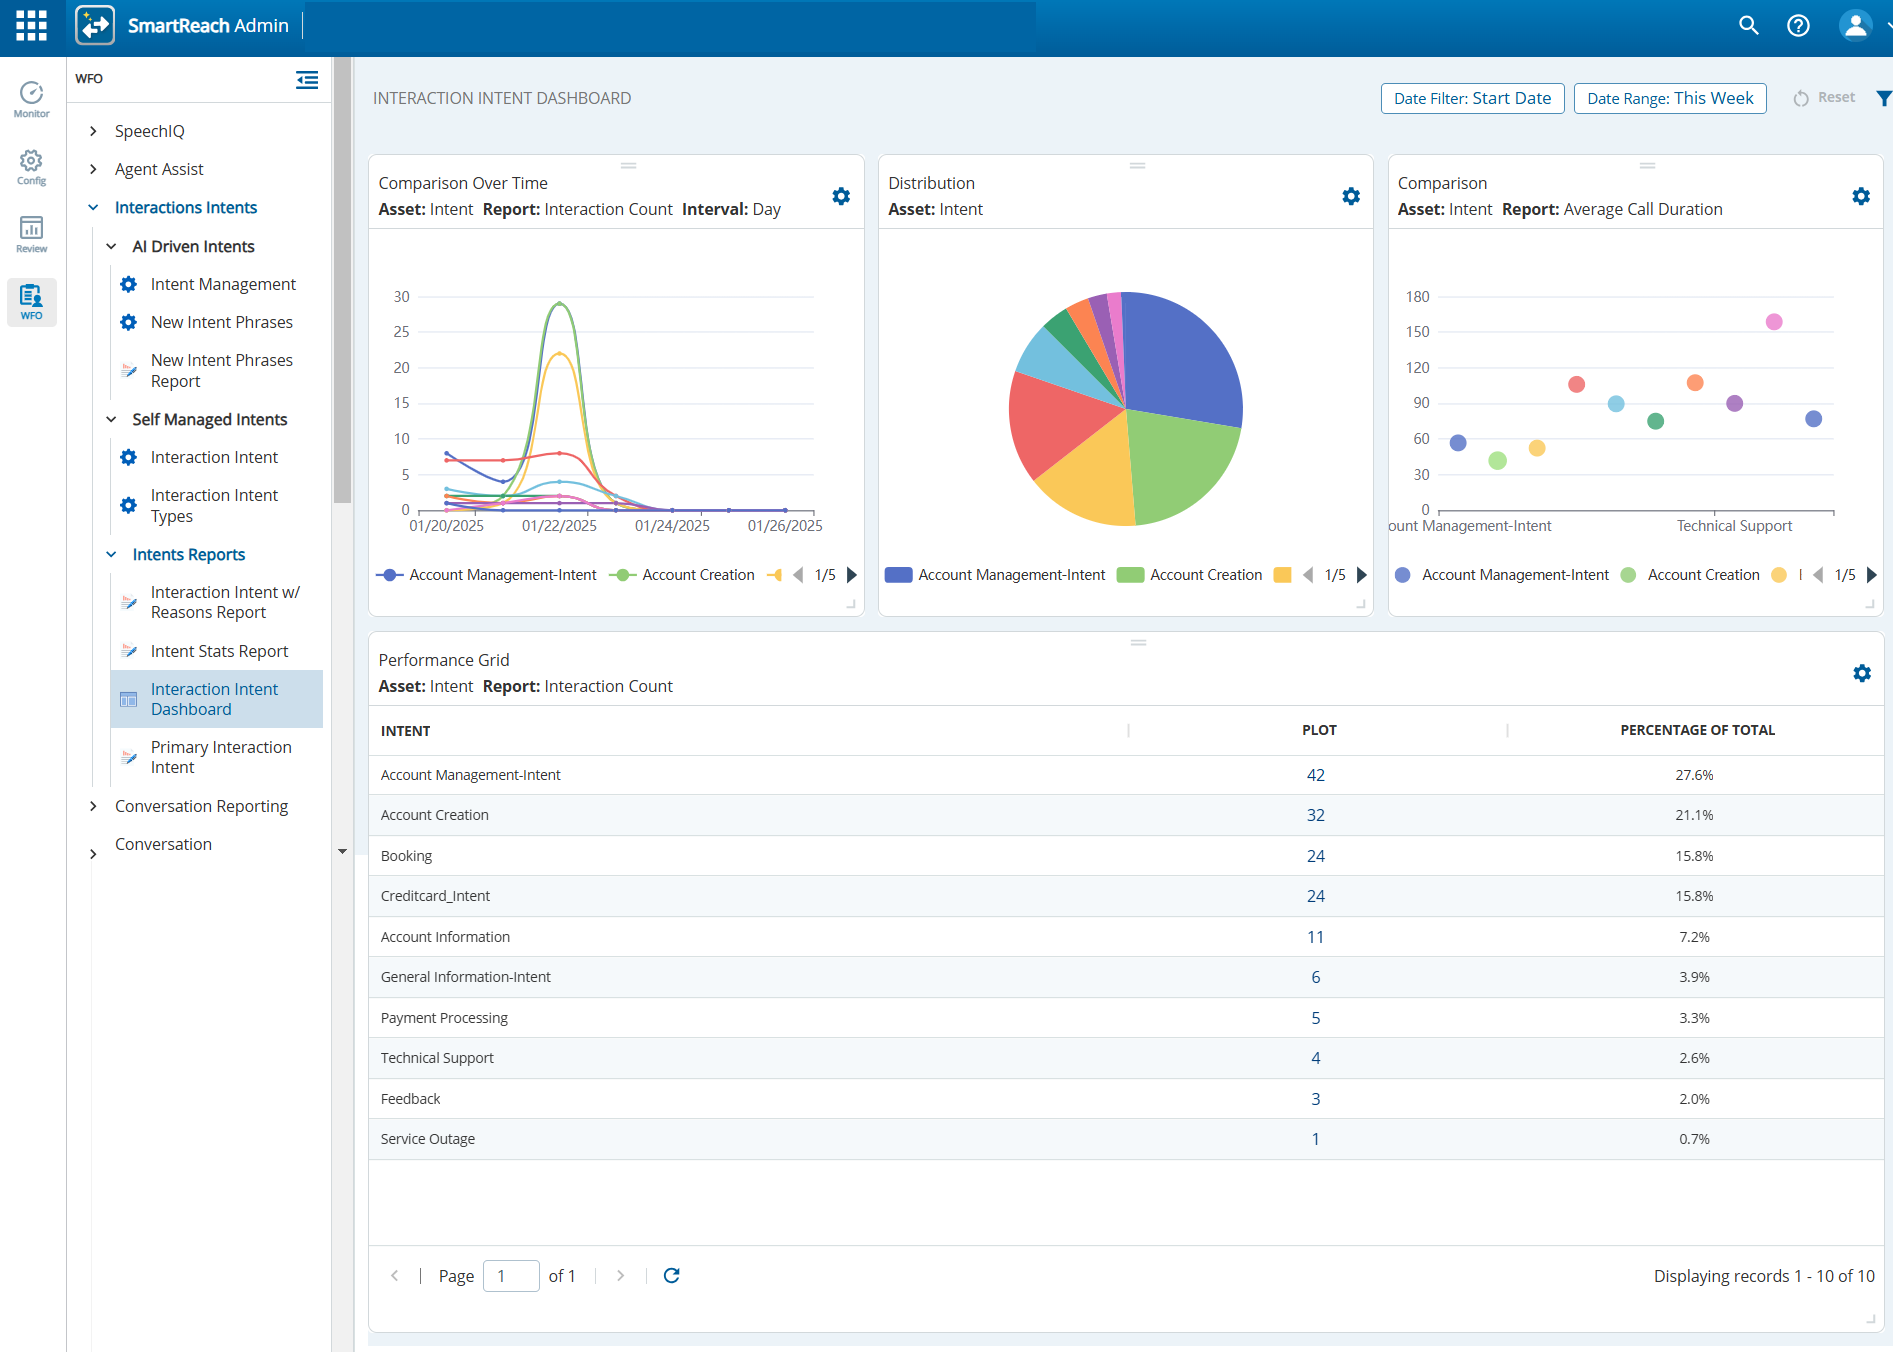
The Interaction Intent Dashboard provides a single view of all the interaction-related data. All the interactions are transcribed and marked to indicate Interaction Intents, Reasons, and Types. The Interaction Intent Dashboard represents this information in the form of charts for better understanding.
Accessing the Interaction Intent Dashboard
To access the Interaction Intent Dashboard window, navigate to the WFO tab, click Interactions Intents > Intents Reports > Interaction Intent Dashboard. The Interaction Intent Dashboard window displays a single-view report of all the interaction-related information.

- Use
 to filter the search criteria. Define the date range and click Apply Filter to apply the search criteria.
- To refresh the report, click
 .
Comparison Over Time
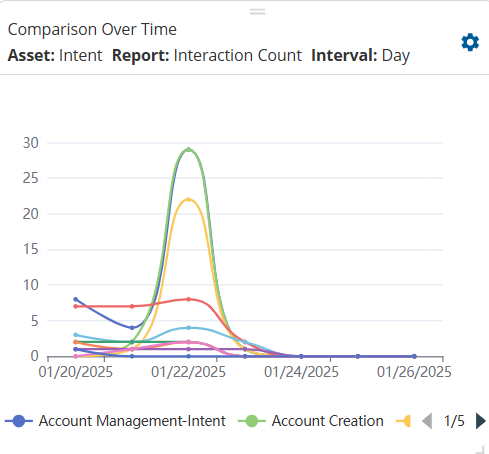
The Comparison Over Time graph compares a selected Asset Type over time in a line chart. You can customize the graph by selecting the Asset Type, Report, and Interval.
Configuring Comparison Over Time Chart
To configure the Comparison Over Time chart:
- Click
 .
The Line Chart Config window opens.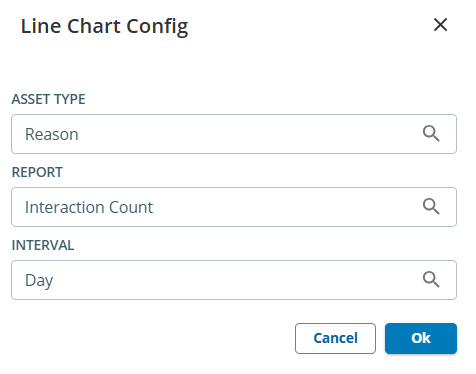
- In the Asset Type field, select one of the following options using
 :
- Intent
- Reason
- Type
- In the Report field, select one of the following options using :
- Interaction Count
- Average Scorecard Score
- Average Silence Duration
- Average Sentiment
- Average Call Duration
- In the Interval field, select one of the following options using :
- Minute
- Hour
- Day
- Week
- Month
- Quarter
- Year
Click Ok.
The Comparison Over Time chart is displayed with the selected options.
Different Asset Types are represented in different colors.
Hover over the chart to see the details of the information displayed.
By default, the Comparison Over Time chart displays the top 5 intents with Asset Type as Intent, Report as Interaction Count, and Interval as Day.
Distribution
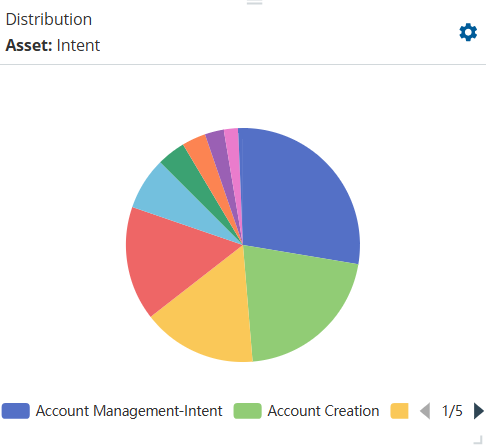
The Distribution chart shows the distribution of the selected asset in the form of a pie chart. You can change the Asset Type to display the required data.
Configuring the Distribution Chart
To configure the Distribution chart:
- Click
 .
The Pie Chart Config window opens.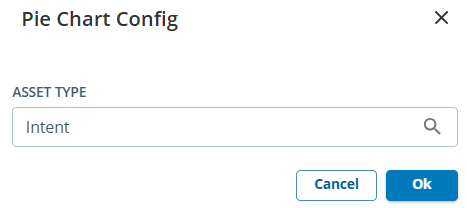
- In the Asset Type field, select one of the following options using :
- Intent
- Reason
- Type
Click Ok.
The Distribution chart is displayed with the selected options.
Different Asset Types are represented in different colors.
Hover over the chart to see the details of the information displayed.
By default, the Distribution graph shows the distribution of the top 5 intents if no Asset Type is selected.
Comparison
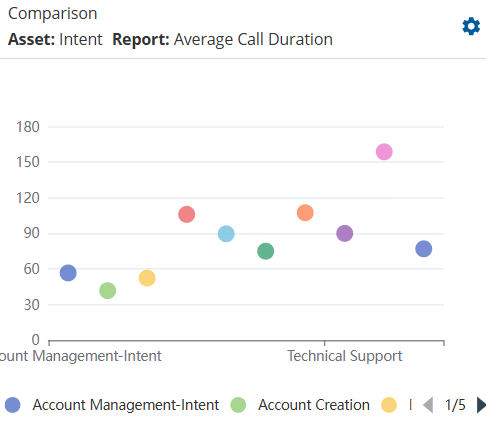
The Comparison chart shows the distribution of Asset Type against a selected Report.
Configuring a Comparison Chart
To configure the Comparison chart:
- Click
 .
The Scatter Chart Config window opens.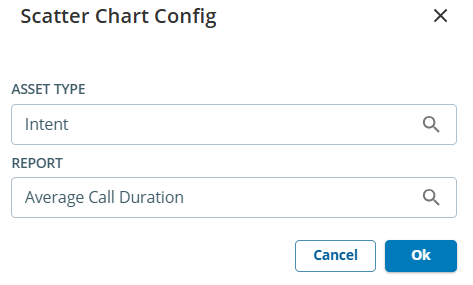
- In the Asset Type field, select one of the following options using :
- Intent
- Reason
- Type
- In the Report field, select one of the following options using :
- Interaction Count
- Average Scorecard Score
- Average Silence Duration
- Average Sentiment
- Average Call Duration
Click Ok.
The Distribution chart is displayed with the selected options.
Different Asset Types are represented in different colors.
Hover over the chart to see the details of the information displayed.
By default, the Comparison chart shows the distribution of the top 5 intents if no Asset Type is selected.
Performance Grid
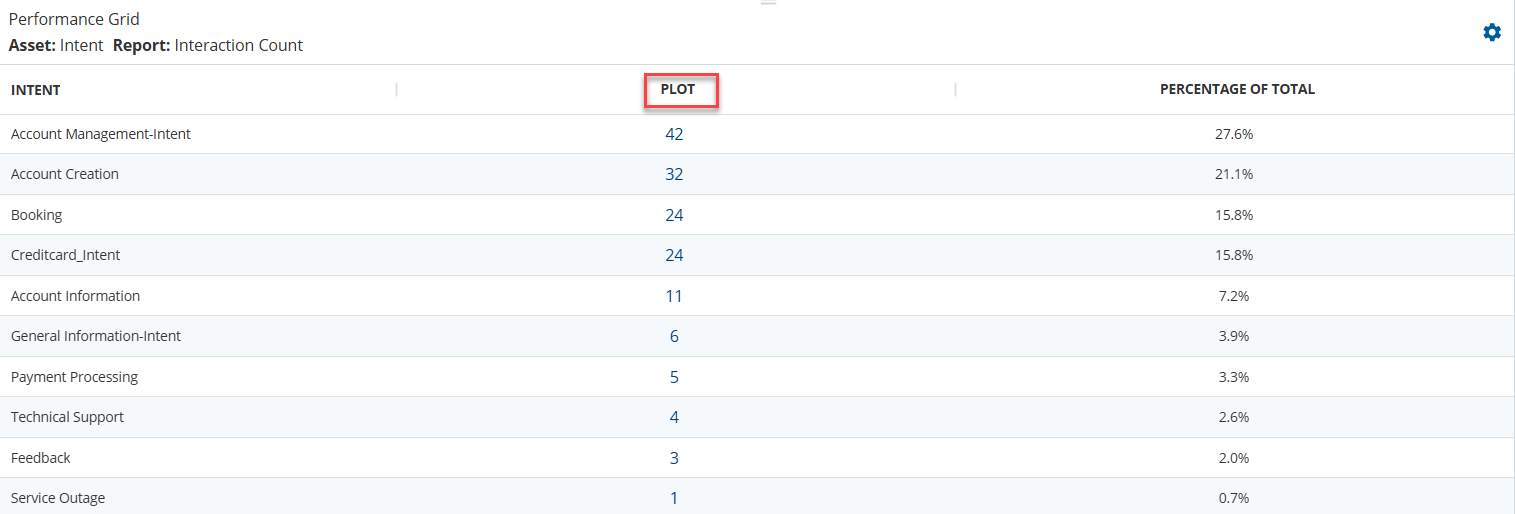
The Performance Grid displays the performance of Asset Types grouped by the Report as a table.
Configuring Performance Grid
To configure the Performance Grid:
- Click
 .
The Intent Grid Config window opens.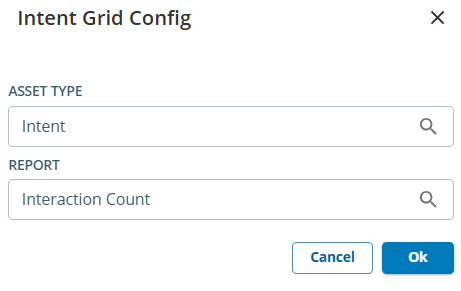
- In the Asset Type field, select one of the following options using :
- Intent
- Reason
- Type
- In the Report field, select one of the following options using :
- Interaction Count
- Average Scorecard Score
- Average Silence Duration
- Average Sentiment
- Average Call Duration
- Click Ok.
The Performance Grid is displayed with the selected options. - Click the values under the Plot column to navigate to the Search and Score screen where filtered data for the Asset Type selected is displayed.