dashboard displays analytics data about specific Key Performance Indicators (KPIs) related to outbound emails. You can use the advanced search option to filter the data related to KPIs. The KPIs are also presented as charts and you can customize the charts according to your requirement.
Filtering Data
You can filter the data using different parameters and view insights according to your selection.
To filter the data:
- Go to the Analytics tab and click Outbound–Email.
Filter the data using the following filters:
Field | Description |
|---|
| Date Range | Date range to filter KPIs. |
| Campaign Type | Type of email campaign. |
| Call Center Name | Name of the call center to which the agent belongs. |
| Service Name | Name of the service assigned to the agent. |
| Message Template Name | Name of the email template. |
| Campaign Name | Name of the campaign. |
After you filter the data, the KPIs on the dashboard reflect the selected filter criteria.
Viewing KPIs
KPIs allow you to analyze outbound emails. You can set alerts for KPIs so that an email is triggered when the KPI reaches the specified limit.
To view KPIs and set alerts for KPIs:
- Go to the Analytics tab and click Outbound–Email.
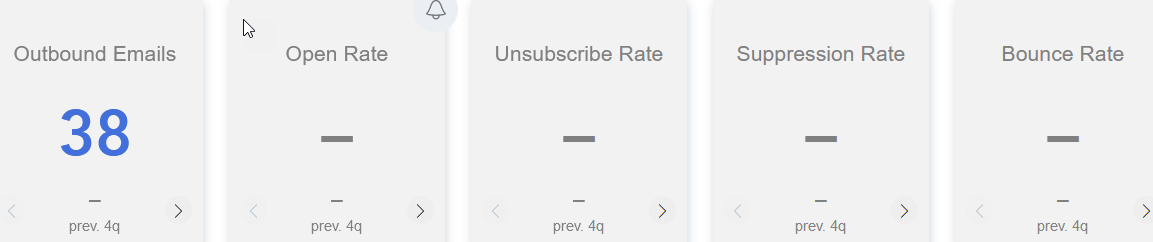
View the following KPIs on the dashboard:
Field | Description |
|---|
| Outbound Emails | Total number outbound emails for the specified filter criteria. |
| Open Rate | Percentage of emails that were opened by the recipients. |
| Unsubscribe Rate | Percentage of recipients who unsubscribed to emails. |
Suppression Rate | Number of times the senders act upon the recipient's choice of opting out of an email list, or when the recipient’s email server or service provider rejects the emails sent to that address. |
Bounce Rate | Percentage of emails that bounce back. |
- To set an alert for a KPI, click the bell icon
 on the KPI.
 - Specify when you want to receive the alert and then click Set Alert.
Viewing Insights
The dashboard displays outbound email volume insights, insights related to click rate, and insights related to email stats:
Insight | Description |
|---|
| Outbound Emails and Open Rate Trend | Displays insights related to outbound emails and the number of emails that the recipients opened. |
| Email Click Rate Trend | Displays insights related to the percentage of links that the recipients clicked from the opened mails. |
| Email Volume and Open Rate by Message Template | Displays insights related to the number of emails sent and the open rate by message template. |
| Email Stats by Campaign | Displays insights related to outbound emails, open rate, and click rate by campaign name. |
To view additional information about the insights using the metrics and attributes available in the insight:
- On the insight, click the ellipsis icon
 and then click Explore from here. The insight opens in a new window.
 Customize the insight by dragging and dropping measures and attributes from the data zones.
Exporting the Dashboard to PDF
You can export the dashboard to PDF. To export:
- Go to the Analytics tab and click Outbound–Email.
- On the upper-right corner of the dashboard, click
 and then click Export to PDF.
The dashboard is exported in PDF format.
Scheduling Emails
You can configure email delivery so that the dashboard is sent as an email attachment to the email ID you specify.
To schedule emails:
- Go to the Analytics tab and click Outbound–Email.
- On the upper-right corner of the dashboard, click and then click Schedule emailing. The Schedule email delivery window appears.

- In the To field, add the email ID of the recipient.
- In the Subject field, to change the subject, edit the existing subject line.
- In the Message field, to change the message, edit the existing message.
- From the First occurrence calendar, select a date and time on which you want to receive the first email.
Emails are sent based on your time zone. - From the Repeats drop-down, select a frequency for the emails.
- Click Schedule.