The Quality Monitoring Dashboard comprises a high-level overview of the important interaction data, evaluation statistics, agent performance, and tasks queue in the form of charts and tables. You can compare the number of scored interactions with the total number of interactions performed by the agents, and the auto scores percentage with the percentage of the manual score.
To access the Quality Monitoring Dashboard, on the WFO tab, click SpeechIQ > Quality Management Dashboard.
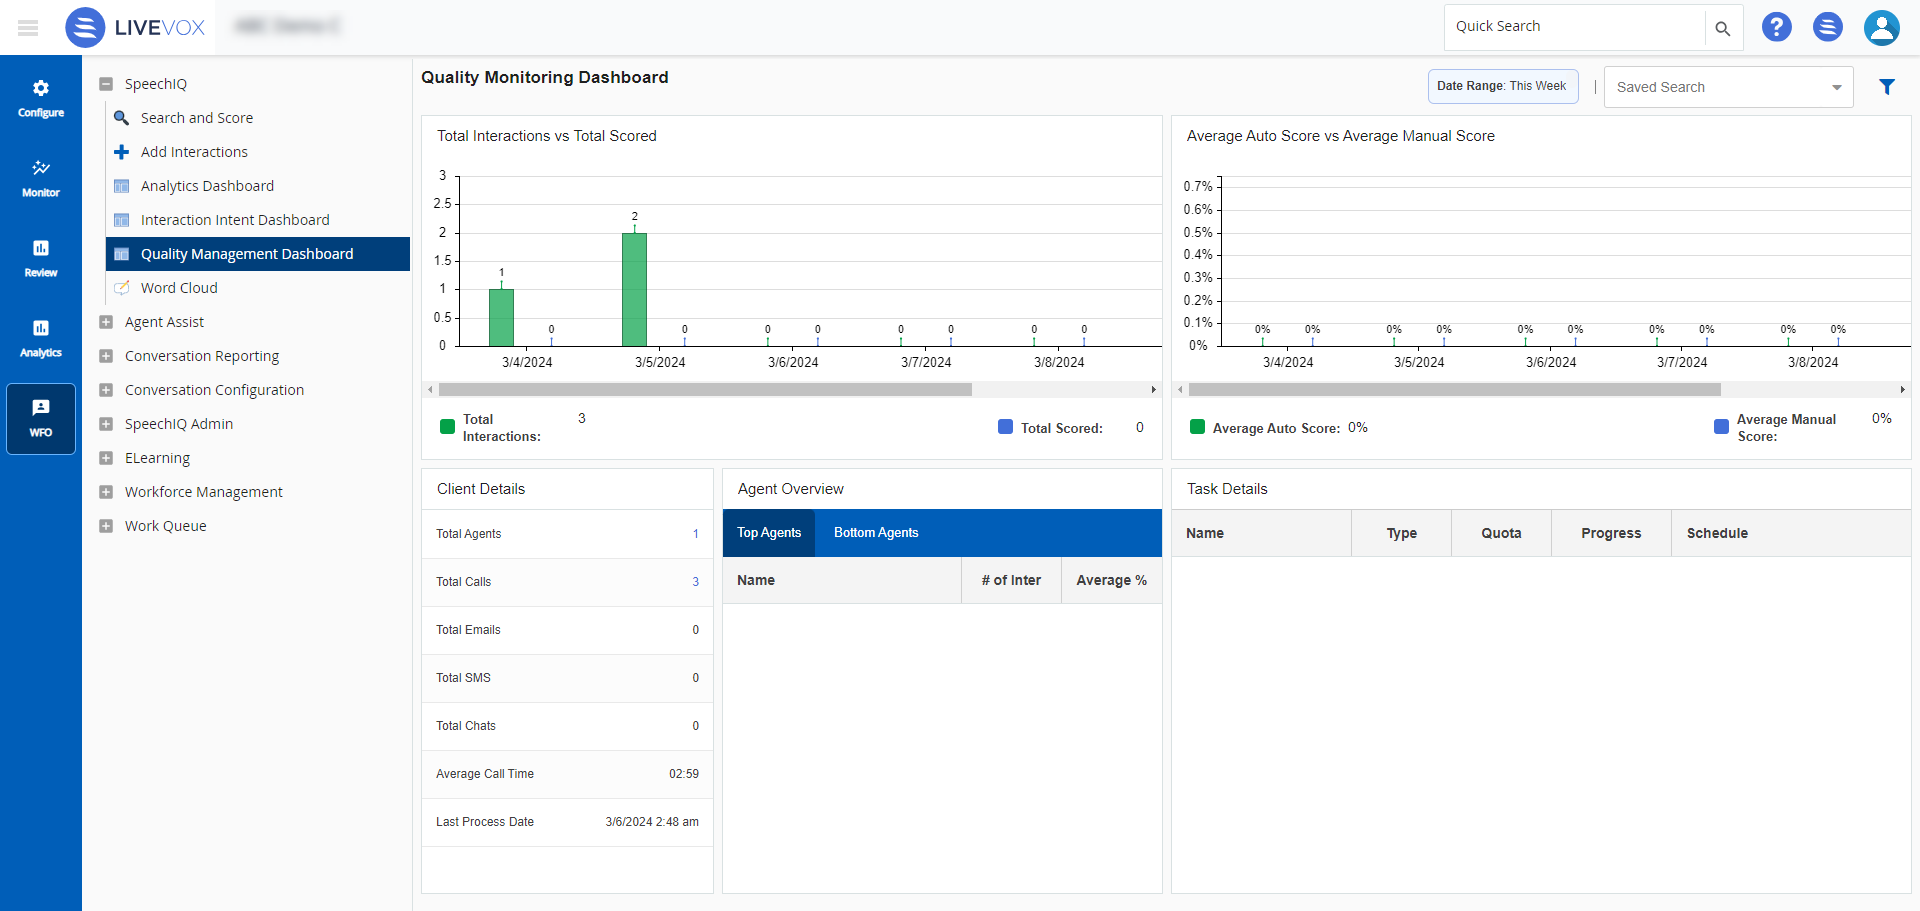
The Quality Monitoring Dashboard window appears.
You can access the statistics for a different period or for different parameters by using theAdvanced Searchicon (). For more information, seeCreating Saved Search.
Statistic Descriptions
The following table describes the statistics displayed in the Quality Monitoring Dashboard:
Statistic
Description
Total Contacts vs Total Scored
Compares the total number of contacts made by all agents (green bar) and the total number of interactions scored (blue bar). You can hover over a bar in the diagram to view the date of processing the data, as well as the total number of contacts and the total number of interactions scored, in numbers.
Avg Auto Score vs Avg Manual Score
Compares the average auto score (green bar) and the average manual score (blue bar) of all agents across all interactions. You can hover over a bar in the diagram to view the date of processing the data, as well as the average auto score and the average manual score, in percentages.
Client Details
Displays the consolidated data such as, the total number of agents, the total number of interactions made by all agents including calls, emails, SMSes, and chats, the average call time of all agents, and the date on which the data was last processed.
Clicking the highlighted numbers opens the Search and Score window, where you can find the list of all recorded interactions and detailed interaction metrics.
Agent Overview
Displays the names of the top-performing and bottom-performing agents, the number of scored interactions of each agent, and the average score received by the agent.
Clicking the highlighted numbers opens the Search and Score window, where you can find the list of all recorded interactions by the agent.
Task Details
Displays the type, quota, progress, and schedule of tasks such as calibration or manual scoring.