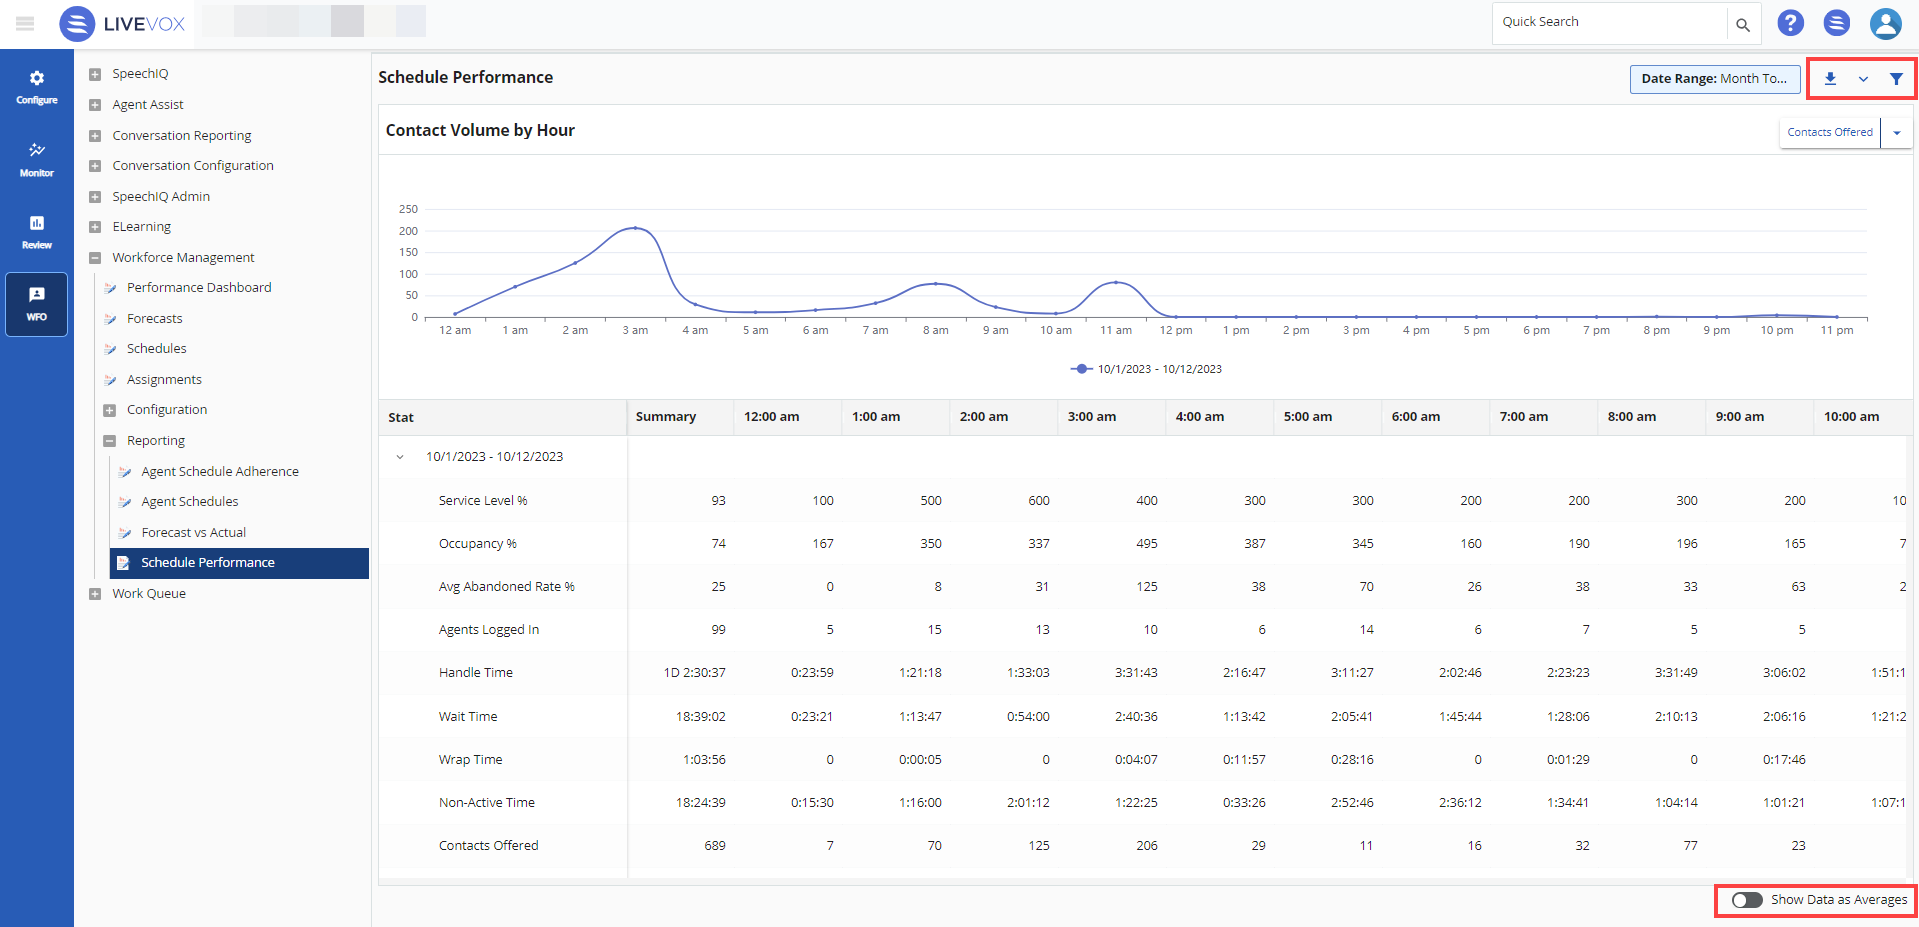
The Schedule Performance report compiles historical call-related data within a defined time frame. This report provides insights into various metrics, including agent count, call handling duration, customer wait times, service level, occupancy, and more. This report enables you to make informed decisions about staffing needs for upcoming shifts.
To access the report, on the WFOtab, navigate toWorkforce Management> Reporting >Schedule Performance.
Click to define the search criteria. The report displays information in both graph and table formats.
On the Schedule Performance window, you can view information only in graph view, table view, or both graph and table view. To select a view, click multiple times and choose betweenShow only graph, Show only table, and Show graph and table options.
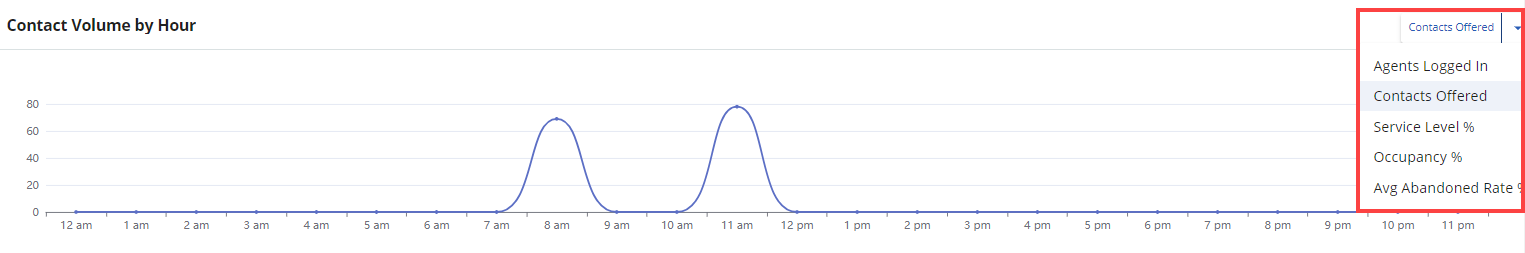
You can select the information in the graph using the options in the drop-down menu. Choose between Agents Logged In, Contacts Offered, Service Level %, Occupancy %, and Avg Abandoned Rate %.
Clickto generate the report and save it to your local storage.
Click Show Data as Averagesto display the table information as average values.
The table displays the following information:
Field
Descriptions
Agents Logged In
Total agents logged in across the selected time range
Handle Time
Total of waiting time + Incall time + Wrap up time expressed as HH:MM:SS (Hours:Minutes:Seconds)
Wait Time
Total wait time for all agents expressed as HH:MM:SS
Wrap Time
Total wrap time for all agents expressed as HH:MM:SS
Non-Active Time
Logged in but not ready + Pause time expressed as HH:MM:SS
Contacts Offered
Total number of inbound + outbound contacts
Successful OP Transfers
Number of operator transfers across the selected time range
Avg Abandon Rate %
Percentage of abandoned calls per hour across the selected time range
Occupancy %
(Total active time in minutes / (total non-active time in minutes + total active time in minutes)) * 100