Download PDF
Download page Performance Dashboard.
Performance Dashboard
The Performance Dashboard is a configurable dashboard that allows you to monitor the performance of your call center, service, team, or agents. The dashboard offers metrics and insights that can be tailored to a specific requirement. The information provided by the Performance Dashboard helps decision-makers analyze critical areas to gauge how effectively a call center, service, team, or agents are working. The Performance Dashboard enables you to:
- Configure tolerance levels for key performance metrics.
- Set automatic trigger alerts to relevant team members to address performance concerns.
- Monitor the performance of teams and analyze the various metrics.
- View agent statistics and quality management scores.
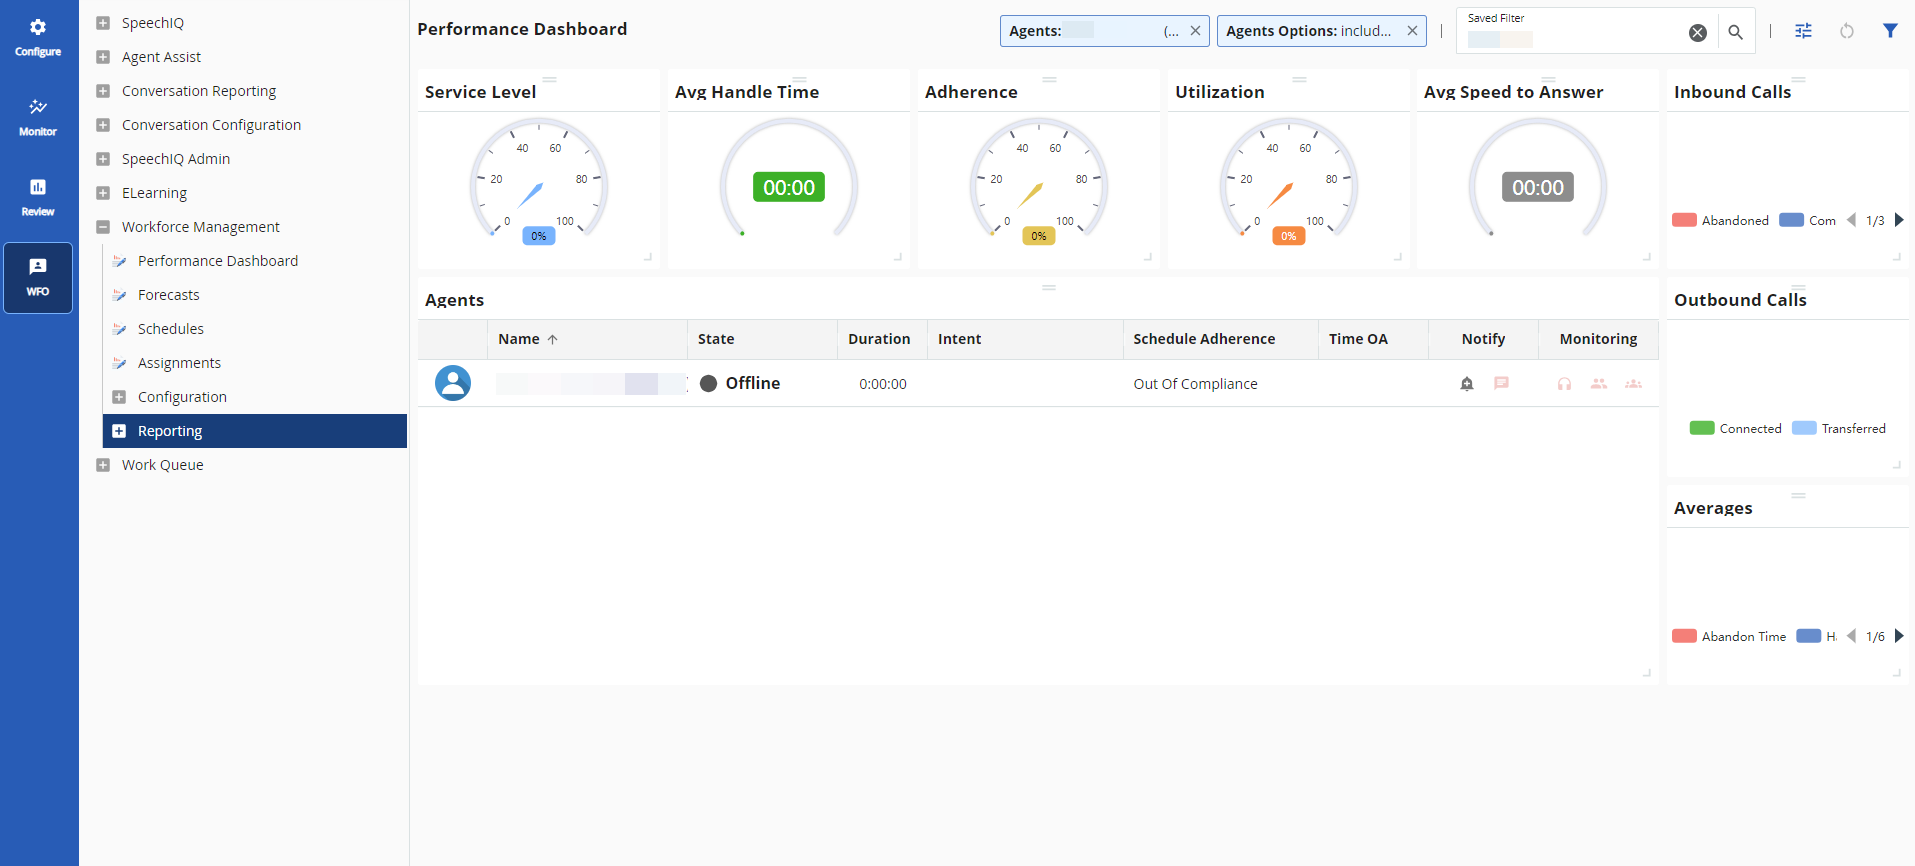
To access the Performance Dashboard, navigate to WFO > Workforce Management > Performance Dashboard. The Performance Dashboard window is displayed.

The top portion of the dashboard displays the following gauges:
- Service Level – Indicates the percentage of calls handled within a given time.
- Avg Handle Time – Indicates the average time taken by the agents to handle a call.
- Adherence – Indicates the percentage of calls adhering to schedules calculated as (minutes in adherence/total scheduled minutes) x 100.
- Utilization – Indicates the percentage of time utilization calculated as (time in ready/total scheduled time) x 100.
- Avg Speed to Answer – Indicates the average speed with which a call is answered.
On the right panel of the dashboard, the following pie charts with different data are displayed:
- Inbound Calls – Displays the number of inbound calls that are Completed, Offered, Handled, and Abandoned.
- Outbound Calls – Displays the number of outbound calls that are Connected, Transferred
- Averages – Displays call handling averages such as Hold Time, Abandon Time, Handle Time, Speed of Answer, Talk Time, Wrap Up Time
The bottom portion of the dashboard provides agent information such as Name, State, Duration, Intent, Schedule Adherence, Time OA, Notify, and Monitoring.
Modifying the Layout
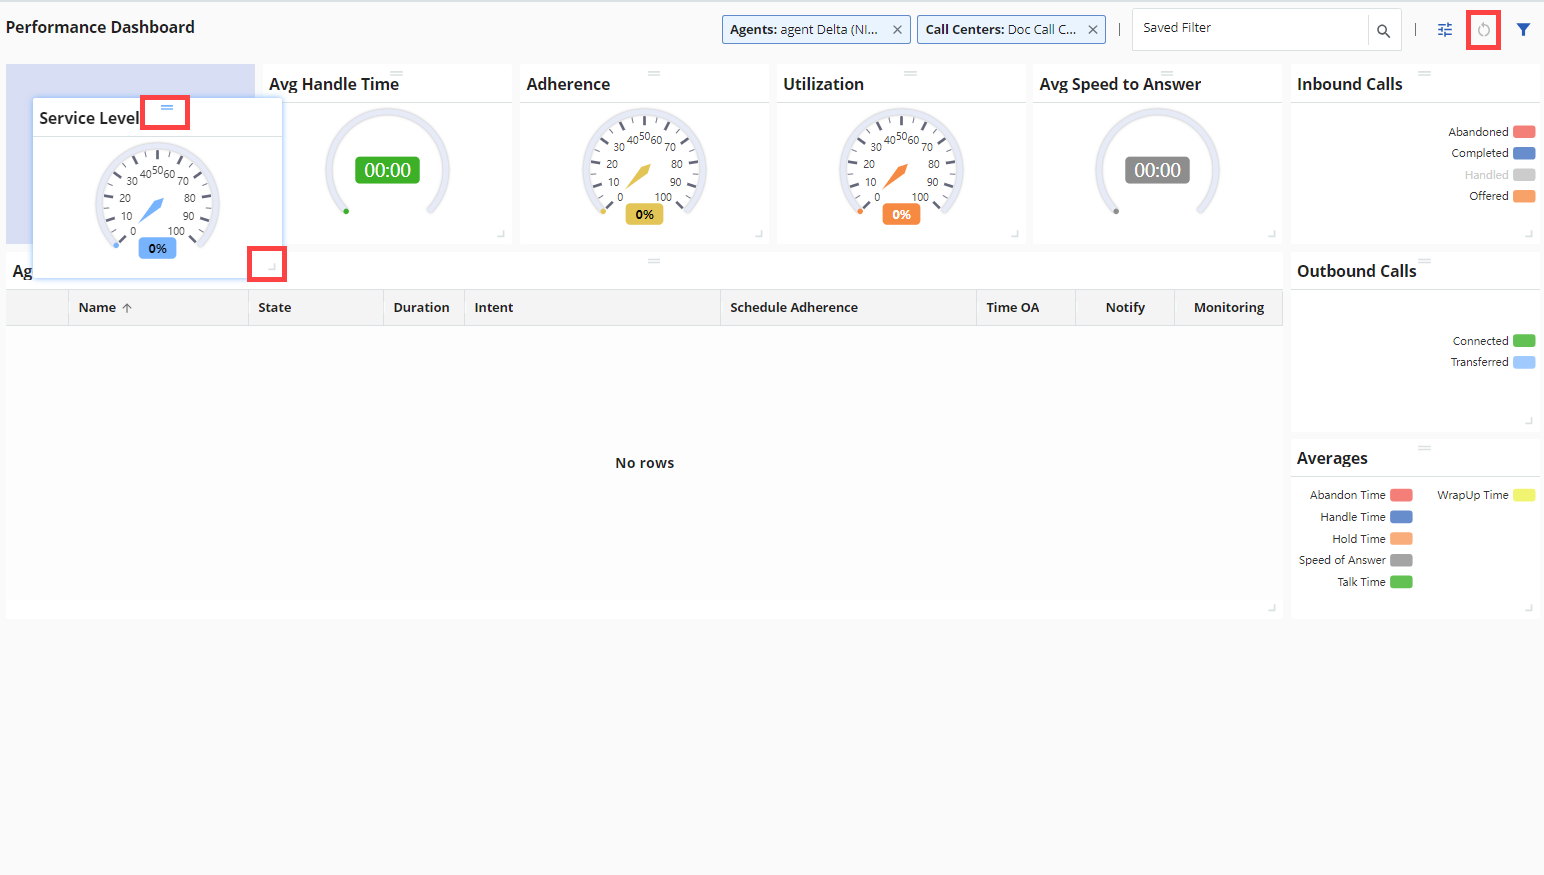
You can customize the layout of the gauges and the charts based on your requirements.
- To move a gauge/chart, click
 and move to the new location.
 - To resize a gauge/chart, click
 and drag to the desired size.
 - To reset the layout, click
 .
.

Tolerance Levels
The Performance Dashboard enables you to set the Tolerance Levels for specified metrics. A tolerance level sets the upper or lower limit of how much something is accepted. When the value is outside the tolerance level, you can configure it to send an automatic alert to the user.
Setting Tolerance Levels
To set tolerance levels:
- Click
 on the top right corner.
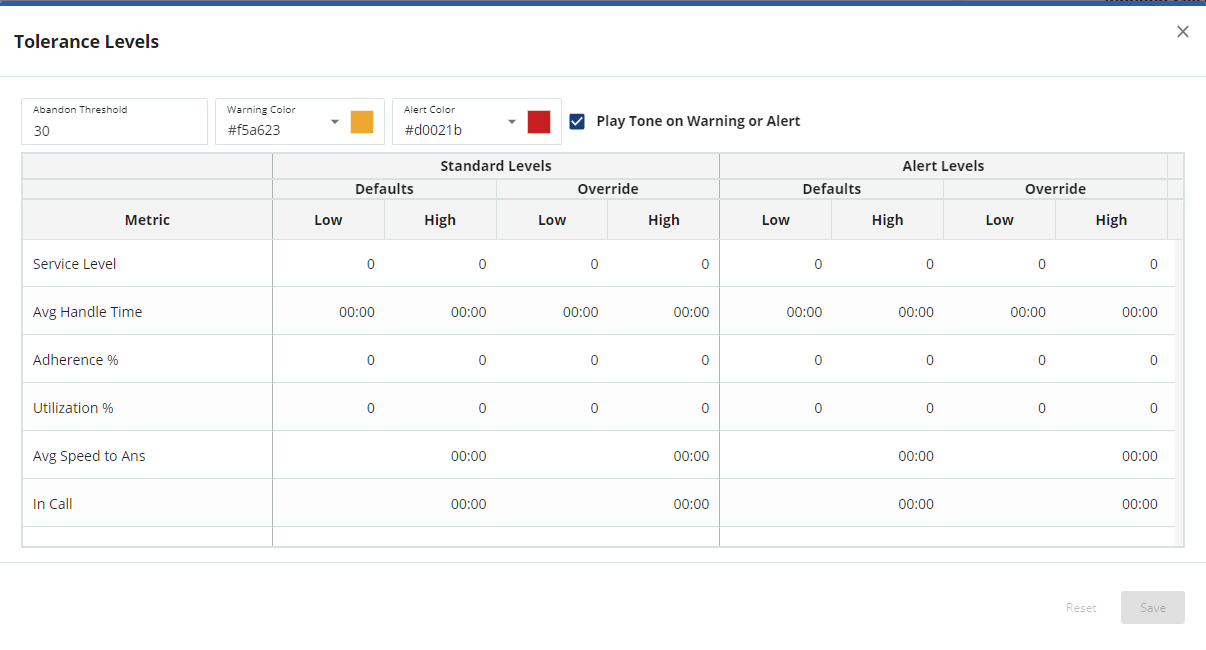
The Tolerance Levels window is displayed.
- Set the Abandon Threshold level.
- Select the Warning Color from the drop-down.
- Select the Alert Color from the drop-down.
- Check the Play Tone on Warning or Alert option to play a tone when tolerance levels reach warning or alert levels.
- In the section below, set the Standard Levels and Alert Levels for the fields listed under the Metric column. Double-click on each cell to enter the required values.
Click Save.
Click Reset to reset the values you have entered.
Creating a Saved Search
If you frequently search for information by using the same search criteria, you can save your search criteria for future use. A Saved Search refers to the saved search criteria.
To create a saved search:
Click
 .
.
The Filter window appears.
To modify an existing filter, search for the filter in the Saved Filter field. Make any changes as required and click Update Filter.
As required, specify values in the filter sections.
If you want to view the results of your search criteria, click Apply Filter.
Click Save Template to save the search criteria. The Save Filter window appears.

In the Name field, specify a name with which you identify the search.
- Select the appropriate View Permissions and Edit Permissions. Choose between All, Only me, and Specific Users.
If you select Specific Users, select the users from the Available list and move to the Selected list. - Click Save.
The saved search is created, and it appears as an option in the Saved Filter field.
The list of saved searches is available for further modifications. Navigate to WFO > Workforce Management > Configuration > Saved Searches to access them.