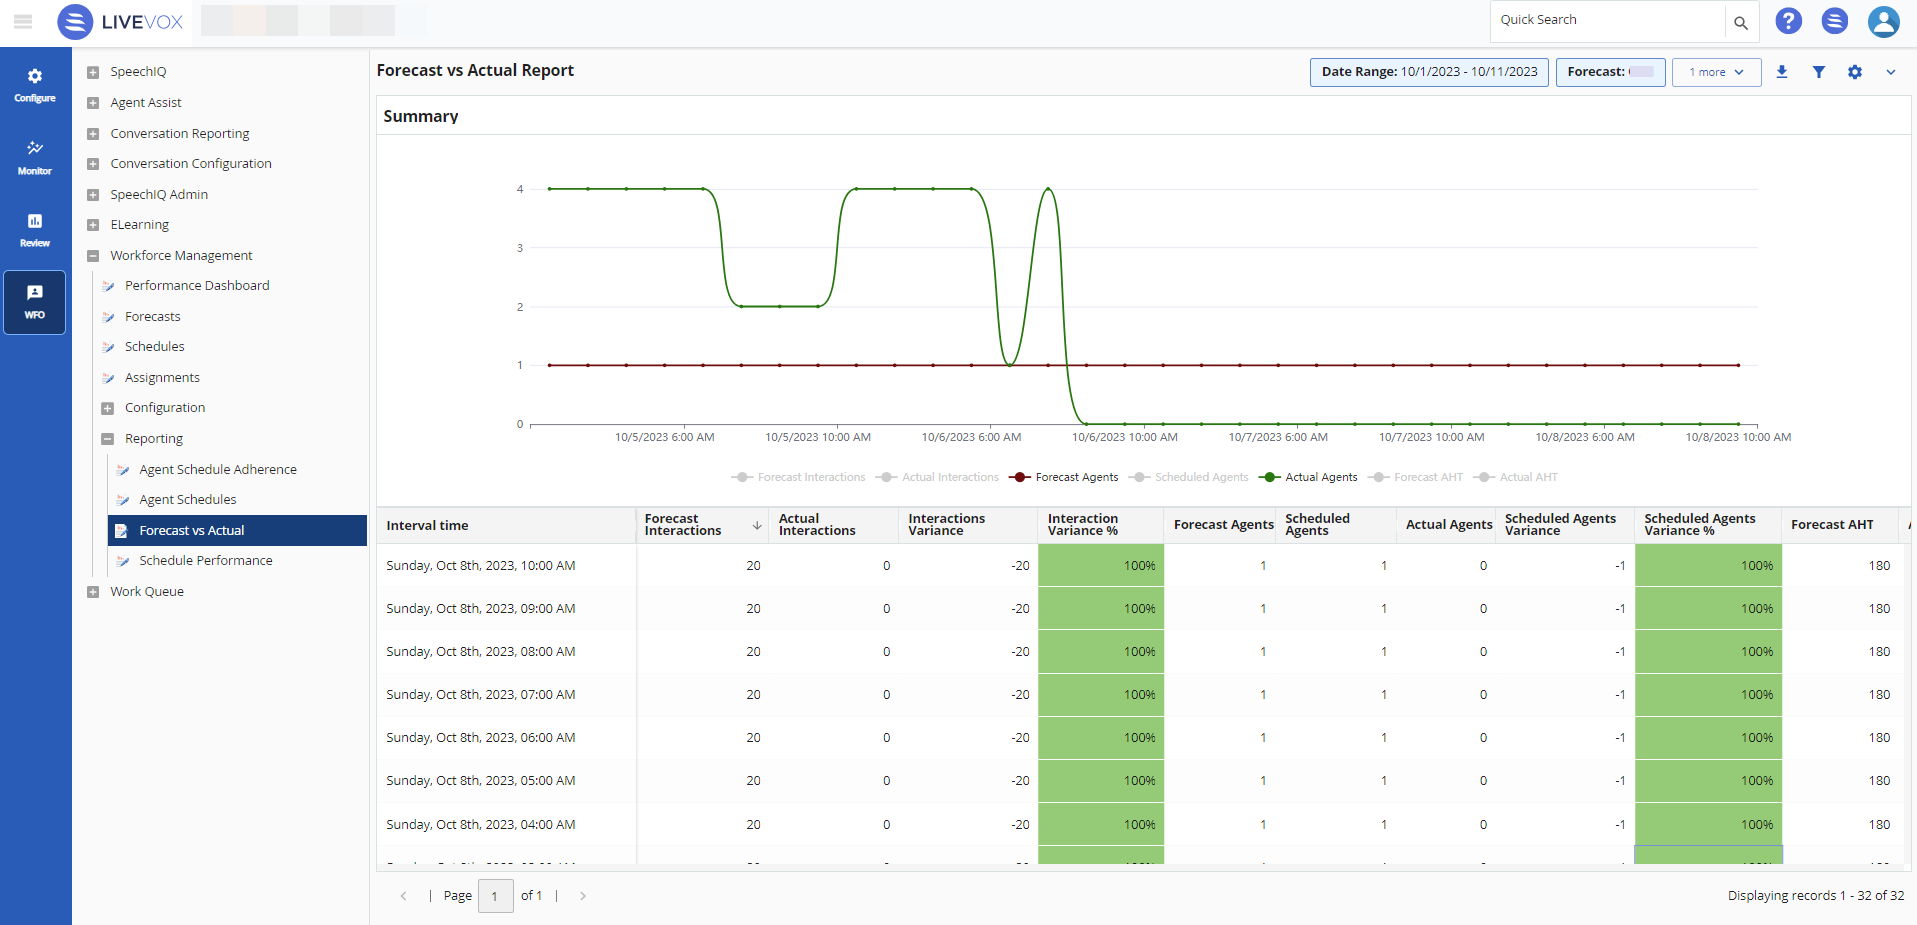
The Forecast vs Actual report compares theforecasted and actual values for parameters, such as the number of interactions for a specific duration, the number of agents required, and the average handle time, against the actual values.
The report displays information in a table format, graph format, or both table and graph format. The report defaults to show information in both graph and table format.
Click to download the report.
Use to filter the search criteria. Define the date range and also select specific Forecast and Schedules using the drop-down. Click Apply Filter to apply the search criteria.
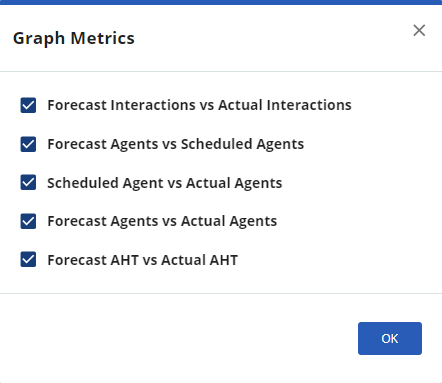
Click to select the metrics for the graph. In the Graph Metrics window, click the desired options and click OK.
Click to toggle between Show on graph, Show on table, or Show graph and table views.