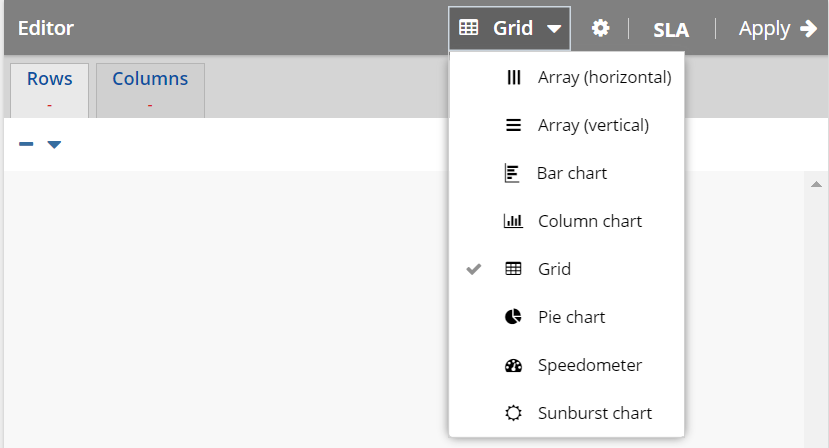
When designing a panel, you can specify the view in which you want the panel to appear on the dashboard.
Example
The following table contains an image as an example to represent each view.
| View | Example |
|---|
Array (horizontal)
| |
| Array (vertical) | |
| Bar chart | |
| Column chart | |
| Grid | |
| Pie chart | |
| Speedometer | |
| Sunburst chart | |
Tabs
The following table contains the names of the tabs that appear in the Editor window when designing a panel, for each view.
| View | Tabs |
|---|
Array (horizontal)
| |
| Array (vertical) |
| Bar chart | |
| Column chart |
| Grid | |
| Pie chart | |
| Speedometer | |
| Sunburst chart | |
- For the bar, column, pie, and sunburst charts, in the Editor window, you can select the following types of colors by using the Colors menu:
- Monochrome: Displays the sections of the chart in various shades of the same color.
- Pastels: Displays the sections of the chart in pastel colors.
- Single hue: Displays the sections of the chart in the same color.

- In the Editor window, you can also modify the font size and the frame color for the panel by using the gear icon
 .


