The Agent Productivity dashboard displays analytics data related to specific Key Performance Indicators (KPIs) of agent productivity. The Agent Productivity dashboard provides insights about agent status, in-call time, and time required to complete a call.
Use the advanced search option to filter the agent productivity data related to KPIs. The KPIs are also presented as charts and you can create customized insights using the KPI charts.
Filtering Data
You can filter the data using different parameters and view insights according to your selection.
To filter data:
- Go to the Analytics tab and click Agent Productivity.
Filter the data using the following filters:
Field | Description |
|---|
| Date Range | Date range to filter the KPIs. |
| Call Center Name | Name of the call center to which the agent belongs. |
| Service Name | Name of the service assigned to the agent. |
| Agent Team Name | Name of the agent team. |
| Agent Name | Name of the agent. |
After you filter the data, the KPIs on the dashboard reflect the selected filter criteria.
Viewing KPIs
KPIs allow you to analyze agent productivity. You can set alerts on KPIs so that an email is triggered when the KPI reaches a specified limit.
To view KPIs and set alert on KPIs:
- Go to the Analytics tab and click Agent Productivity.
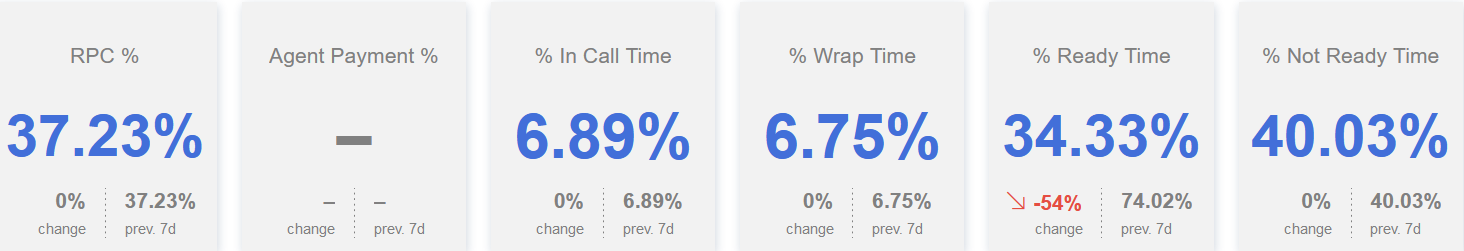
View the following KPIs on the dashboard:
Field | Description |
|---|
| RPC % | The percentage of calls in which contact was made with the intended customer (right-party contact (RPC). |
| Agent Payment % | The percentage payments received by the agent. |
% In Call Time | The percentage of time in which an agent was on a call. |
| % Wrap Time | The percentage of time in which an agent was in the Wrap Up state of a call. |
| % Ready Time | The percentage of time in which an agent was in the Ready state. |
| % Not Ready Time | The percentage of time in which an agent was in the Not Ready state. |
- To set an alert for a KPI, click the bell icon
 on the KPI.
 - Specify when you want to receive the alert and then click Set Alert.
Exploring Trends
The dashboard displays the productive percentage trend, RPC and payment trend, RPC percentage versus goal, payment percentage versus goal, and agent productivity information.
Insight | Description |
|---|
| Productive % Trend | Displays information about agent productive time by date. |
| RPC and Payment Trend | Displays information about the percentage of calls that were made to the intended customers. |
| RPC% vs. Goal | Displays information about the RPC percentage and the goal set for payment. |
| Payment% vs. Goal | Displays information about the payment percentage and the goal set for payment. |
To view additional information about the insights using the metrics and attributes available in the insight:
- On the insight, click the ellipsis icon (
 ) and then click Explore from here.
 - An untitled insight opens.
Customize the insight by dragging and dropping measures and attributes from the data zones.