 or the Flip to Table View icon
 in the widgets, respectively.
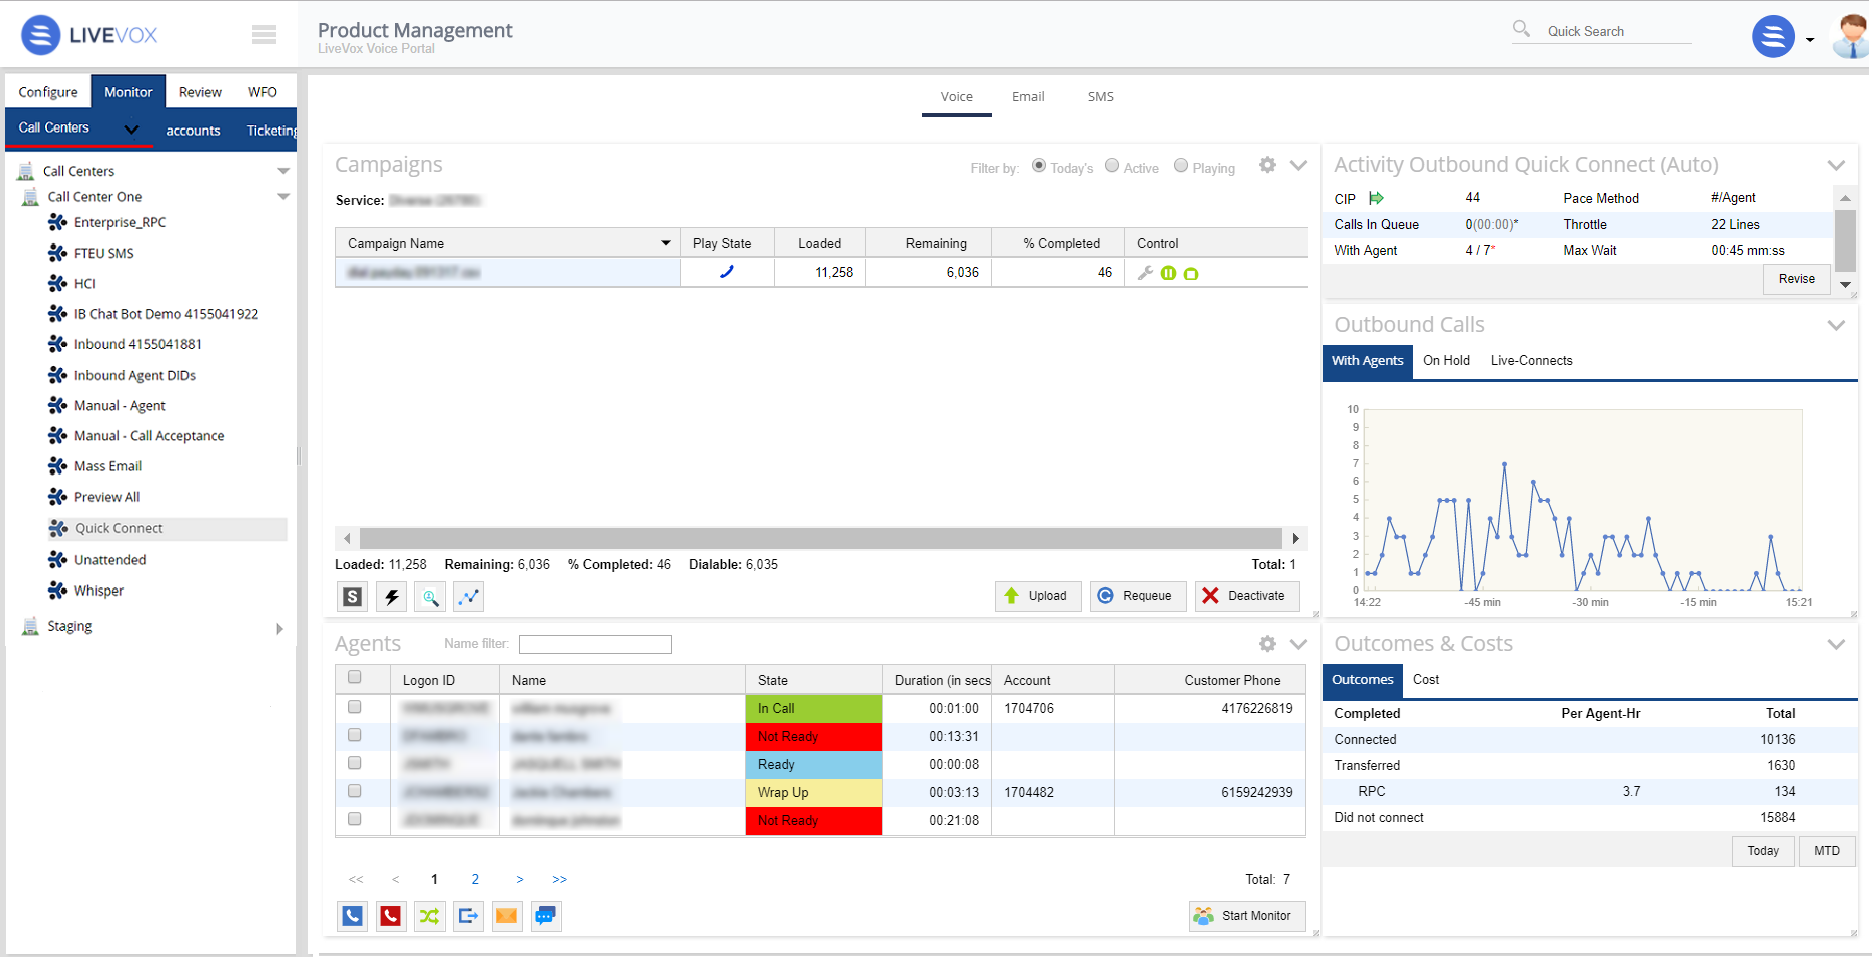
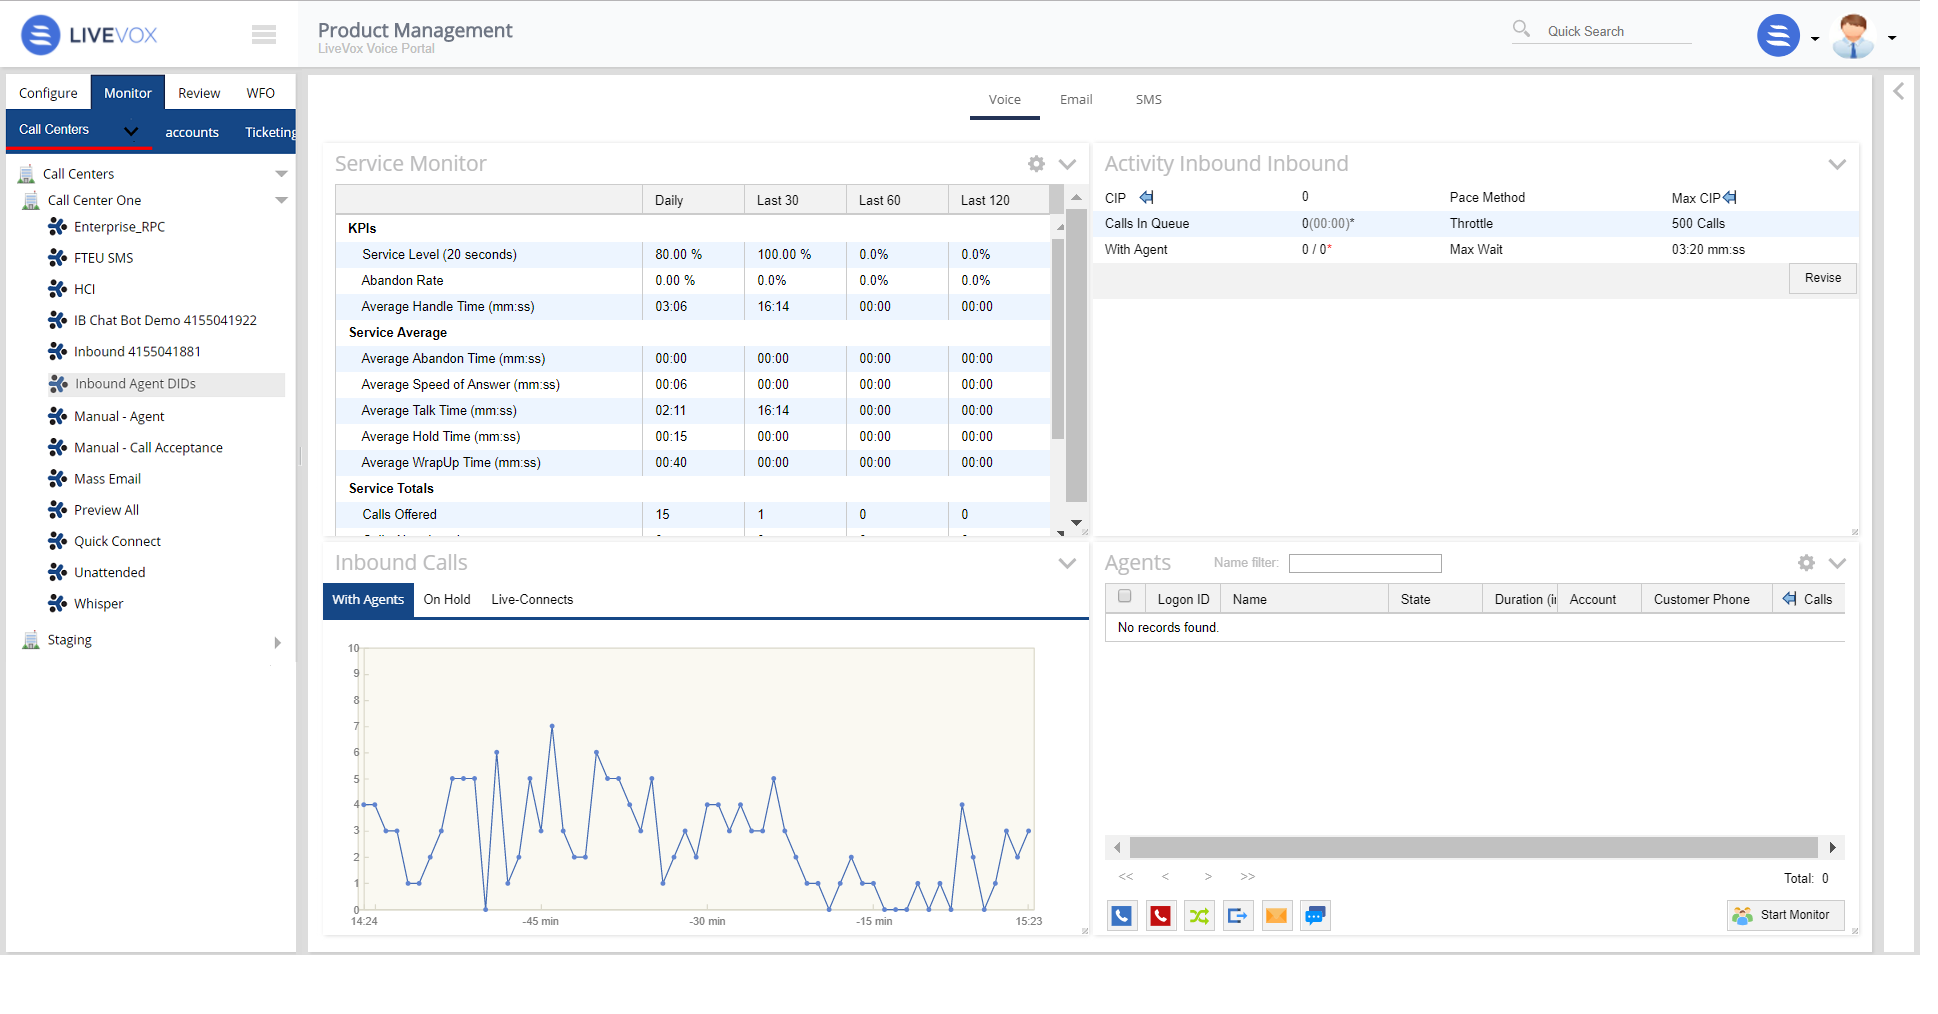
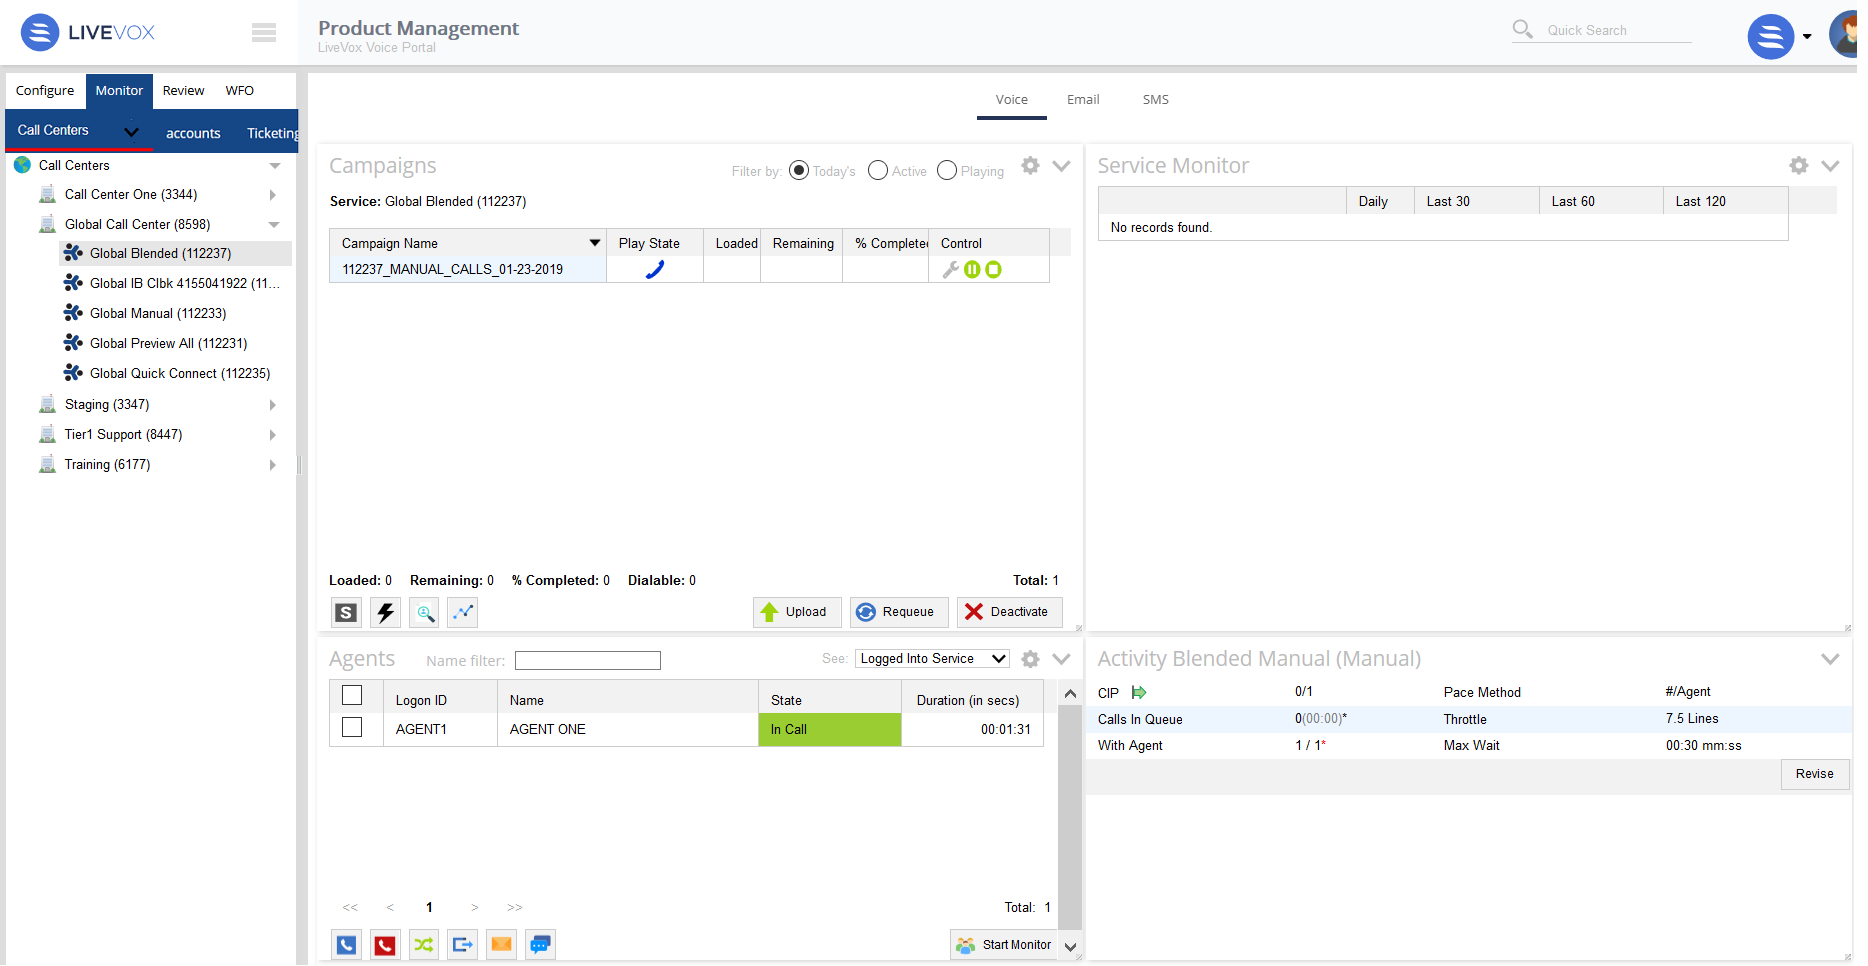
You can monitor the voice channel at the following levels through the Voice section of the monitor dashboard:
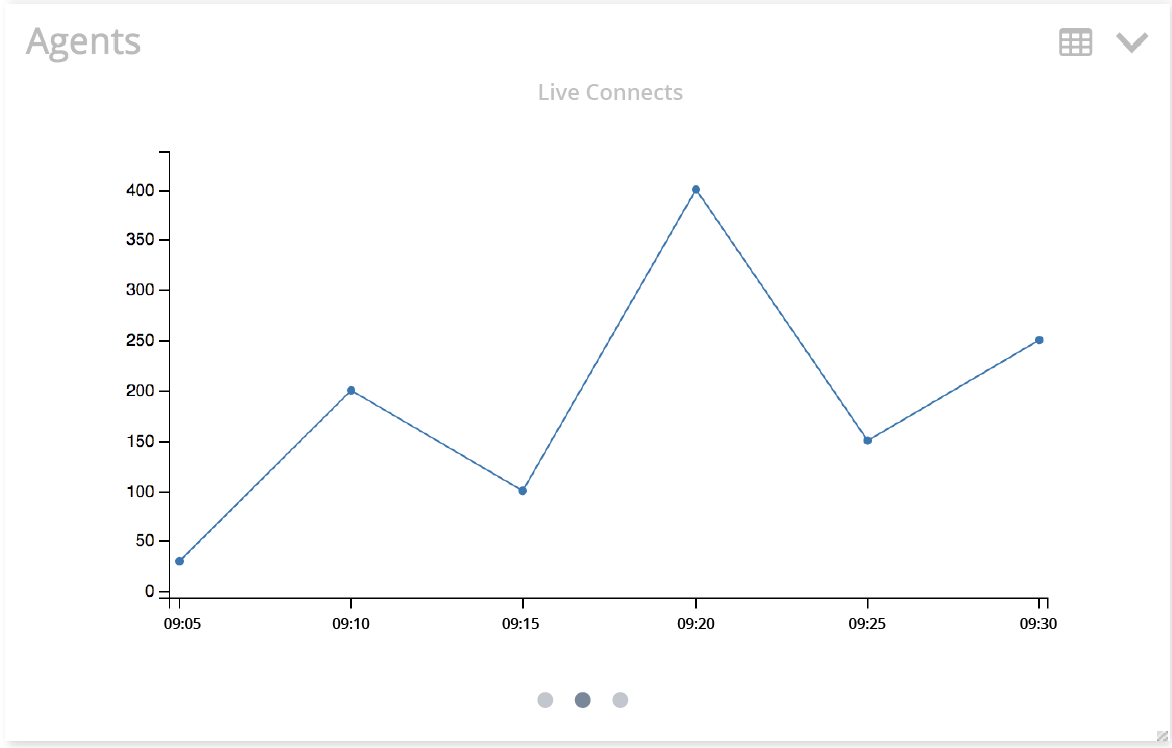
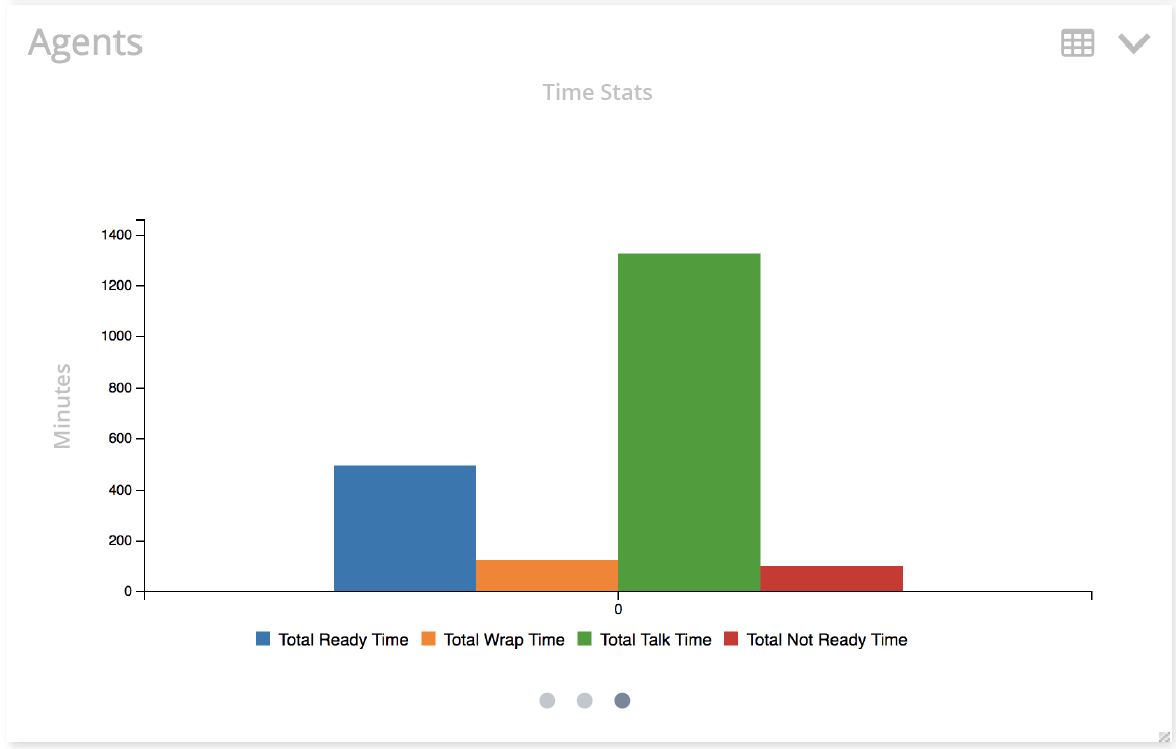
You can change the appearance of the Monitor and Agents widgets to a graphical view or a tabular view by using the Flip to Graphical View icon or the Flip to Table View icon in the widgets, respectively.
|
|
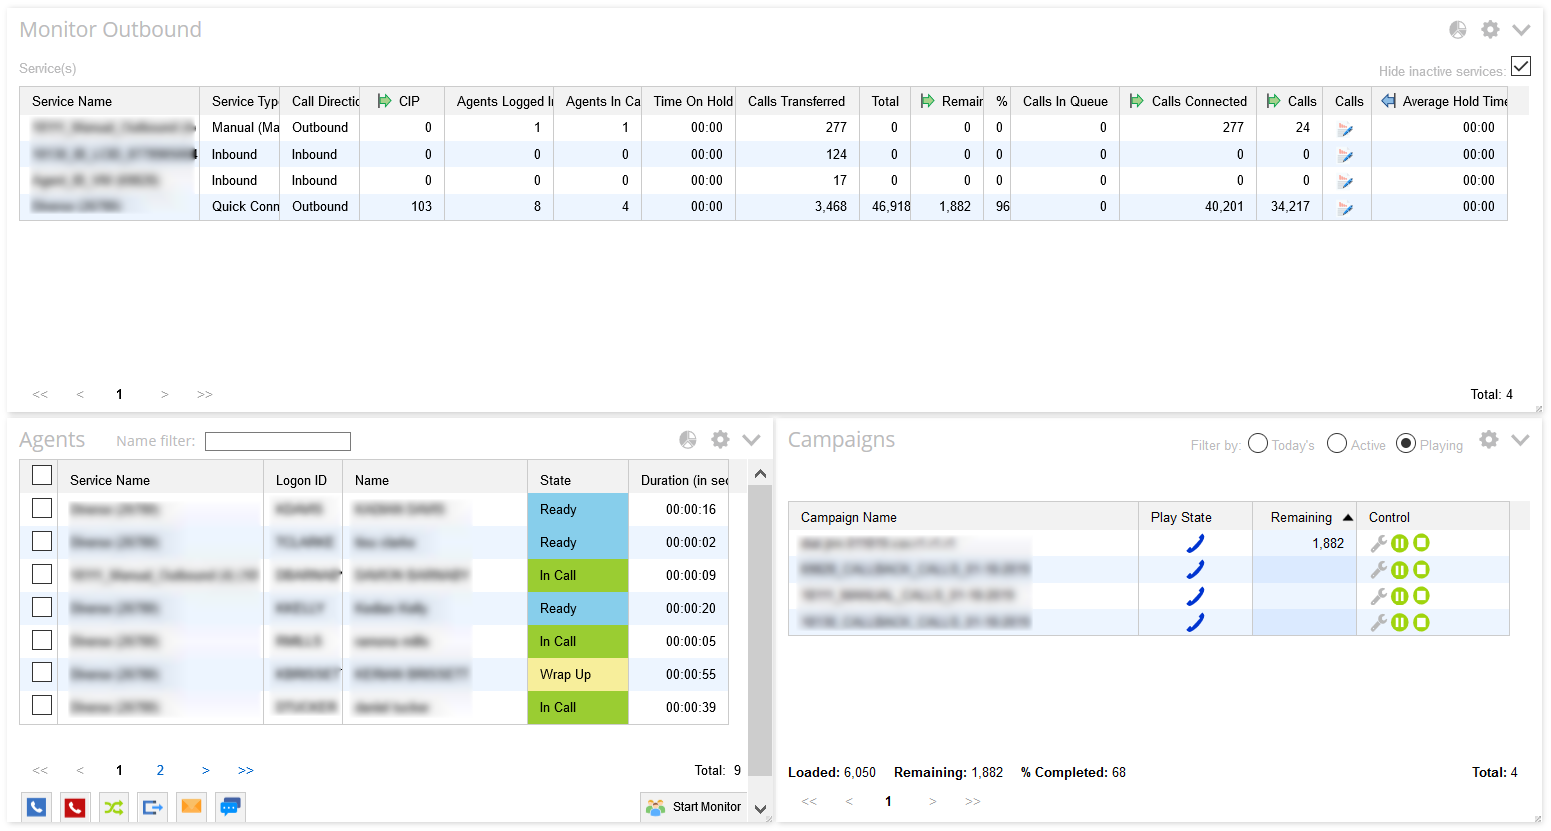
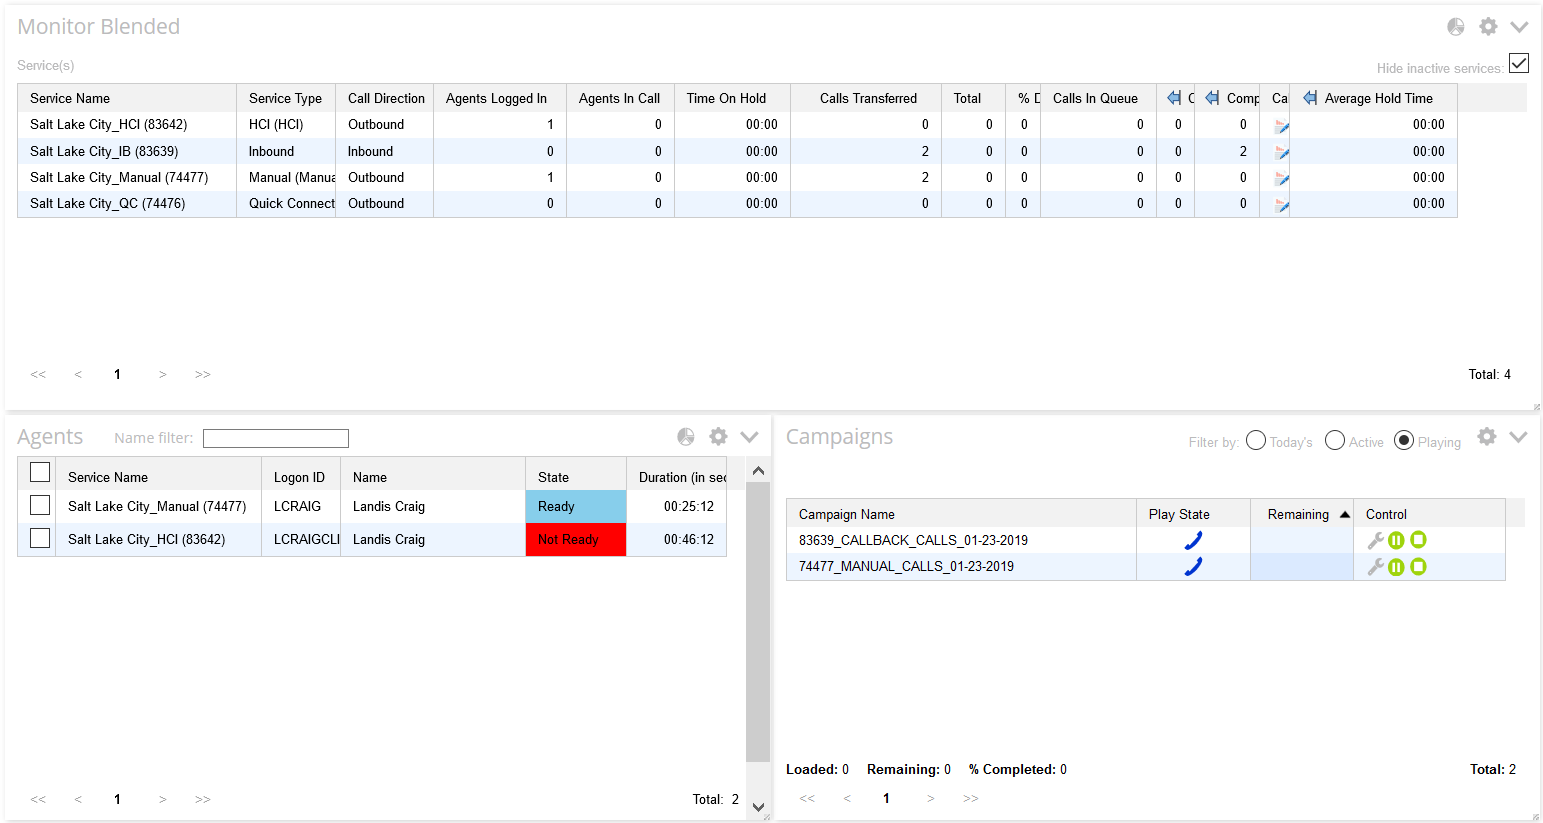
The Monitor widget displays the statistics of outbound, inbound, or blended services depending on the configuration in the GUI Settings window.
|
The types of Monitor widgets are as follows:
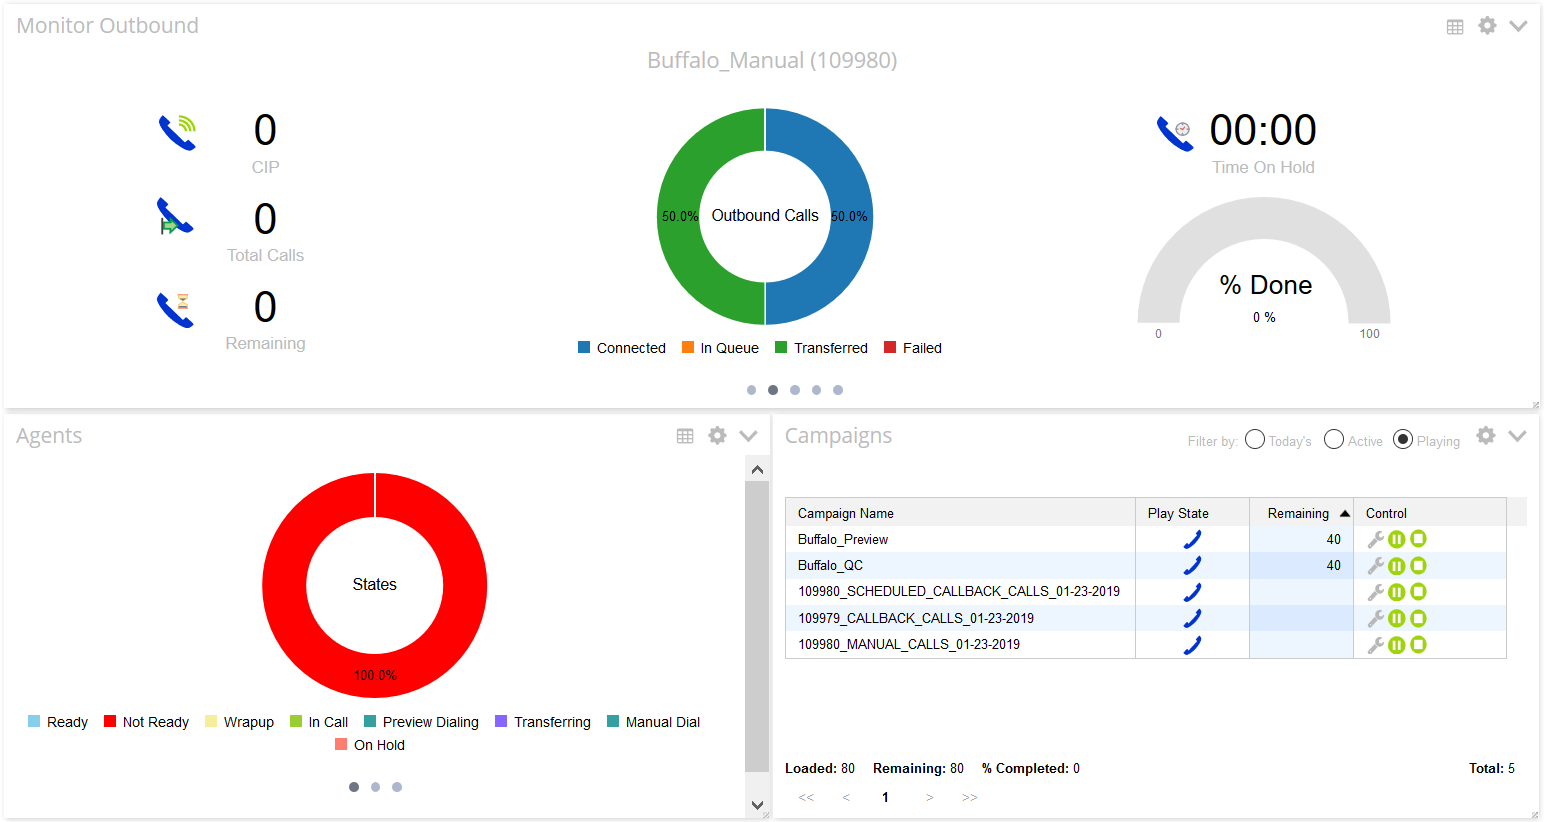
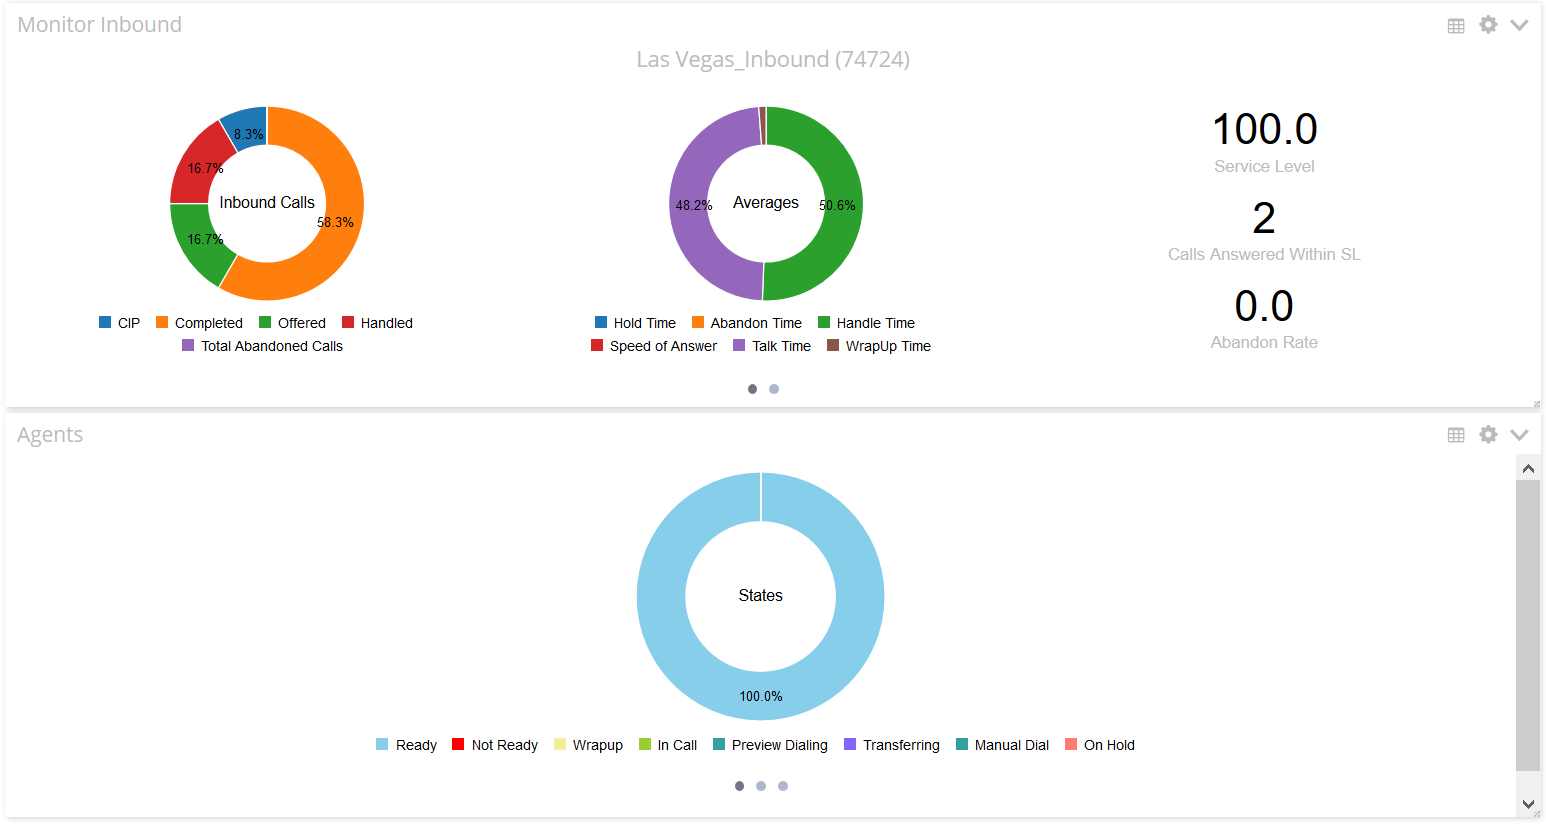
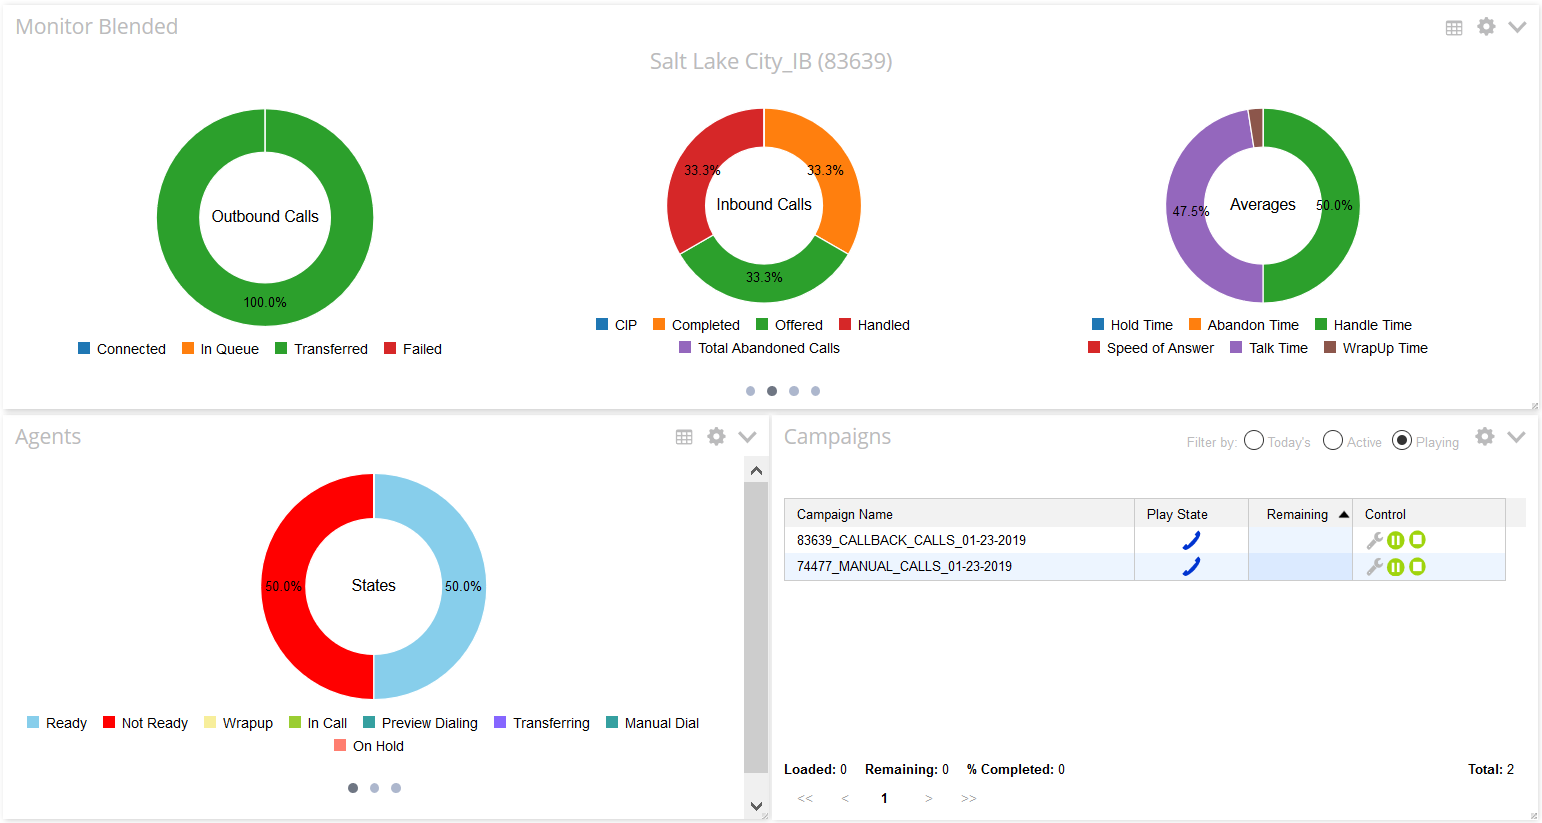
Depending on the view, the following statistics are available at the enterprise level and the call center level.
| Statistic | Description | |
|---|---|---|
| CIP | Calls that are in progress for outbound, blended, or inbound service | |
| Agents Logged In | Number of agents who are signed in to the call center or service | |
| Agents In Call | Number of agents in the call center or service who are currently connected to a call | |
| Time On Hold | Longest hold duration of all calls in the hold queue for the call center or service | |
| Calls Transferred | Number of calls presented to the service for ACD routing | |
| Total/Total Calls | Number of contact records loaded from the campaign | |
| Remaining | Number of contact records remaining to be dialed | |
| % Done | Percentage of contact records for which dialing is completed | |
| Charge | Usage fees for the call center or service | |
| Wait | Number of calls waiting in the queue | |
| Calls Connected | Number of connected calls/transactions | |
| Calls Failed | Number of calls that terminated without a connection | |
| Caller ID | Caller ID configured for the service
| |
| Operator Phone | Operator phone configured for the service
| |
| Callback Phone | Callback phone configured for the service
| |
| Message | Message defined for the service | |
| Today | Real-time report (RTR) for the current day | |
| MTD | RTR for the current month | |
| Past | RTR for a user-defined date range | |
| Calls Handled | Number of calls offered and successfully routed to an agent | |
| Completed | Number of contact records for which dialing is completed | |
| Calls Offered | Number of calls offered to an agent | |
| Calls In Queue | Calls in the ACD queue waiting to be offered to an available agent | |
| Total Abandoned Calls | Difference between the number of offered calls and the number of handled calls | |
| Average Abandon Time | Average duration of the calls that are in the queue (Calls in Queue) for all abandoned calls | |
| Calls Answered Within SL | Number of calls answered by an agent within the service level | |
| Average Speed of Answer | Total queue duration (time that the customer spent in the ACD queue waiting for an agent) for all offered/handled calls | |
| Service Level | (Number of calls answered by an agent within the service level + Number of calls abandoned within the service level) / Calls Offered | |
| Abandon Rate | Total Abandoned Calls / Calls Offered | |
| Average Talk Time | Total talk time / Calls Handled | |
| Average Wrap Time | Total wrapup time / Calls Handled | |
| Average Handle Time | Total handle time / Calls Handled |
If an active campaign is appended with additional records, the following campaign statistics are accordingly updated:
|
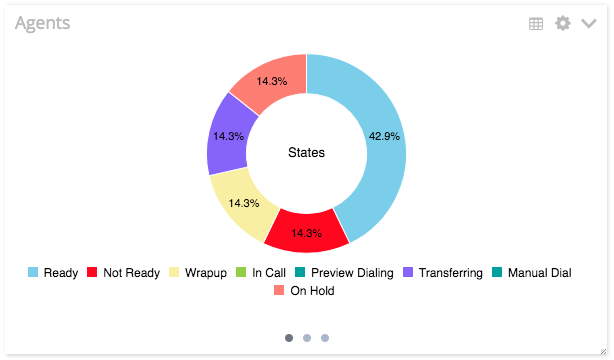
The Agents widget displays the statistics related to agents. In the graphical view, you can access the statistics for agent states, live connects, and time stats by using the carousel that appears at the bottom of the section.
 . For more information, see